Jun-2026
Sales
Trend
6-Month
Product Count
SKUs
Avg Price
YoY Sales Change
YoY Price Change
Market Insights Snapshot
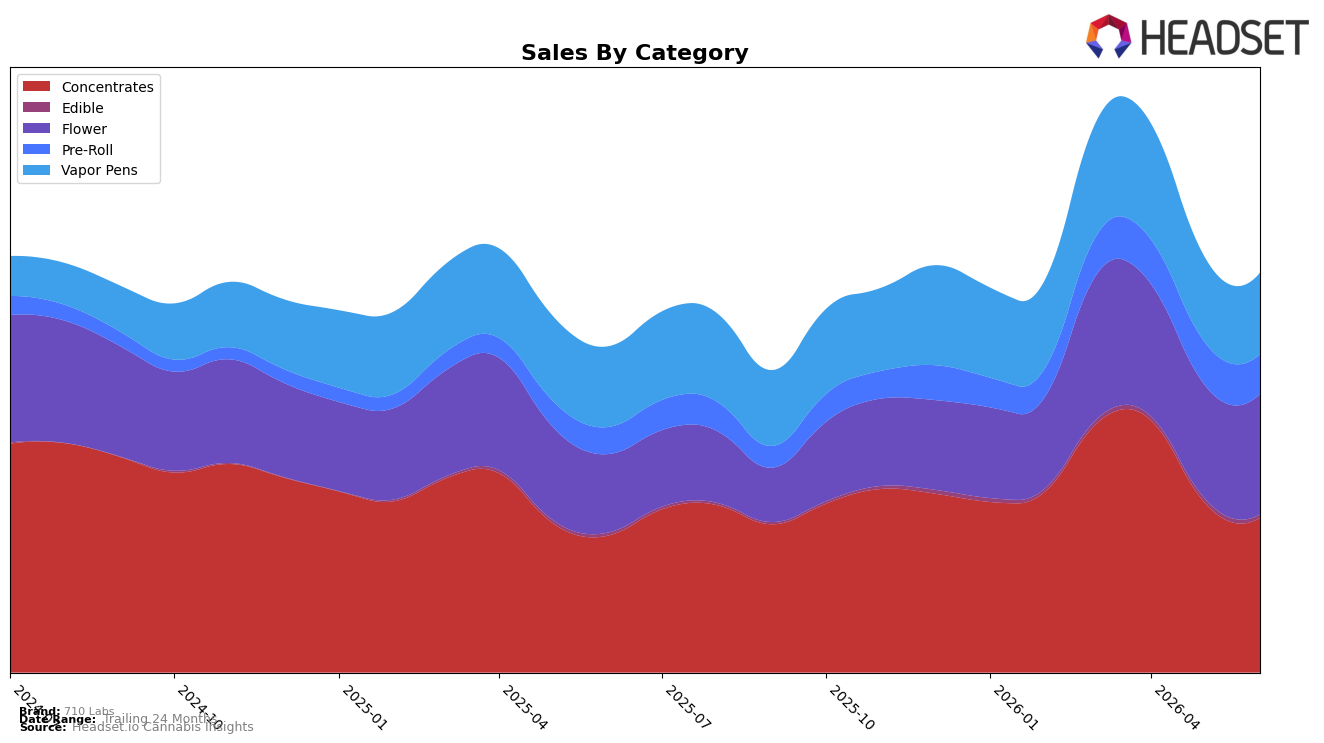
In June 2026, 710 Labs concentrated nearly two-fifths of revenue in Concentrates at 38.48% share with 12.79% year-over-year growth but a -8.91% month-over-month decline, while Flower expanded to 29.99% share with 52.89% year-over-year growth and a 6.01% month-over-month lift. Vapor Pens held 20.36% share with a modest 0.88% year-over-year increase and a -4.28% month-over-month dip, and Pre-Roll reached 10.07% share on 45.41% year-over-year growth despite a -6.98% month-over-month move; Edible remained small at 1.11% share with 13.54% year-over-year but -13.47% month-over-month. With brand-level sales up 22.24% year-over-year and average price up 8.65%, the pattern implies a pivot from a Concentrates-led profile toward a more balanced mix anchored by accelerating Flower and Pre-Roll, softening short-term dependency on month-to-month volatility in Concentrates and Vapor Pens.
Given a rank of 2 in Concentrates in Colorado alongside a -8.91% month-over-month slide in that category and a simultaneous 6.01% month-over-month gain in Flower, the mix shift implies protective diversification against category-specific swings while preserving premium positioning via a $48.35 Concentrates average price and a $60.15 Vapor Pens average price. The 45.41% year-over-year rise in Pre-Roll against a -6.98% month-over-month dip, paired with the 52.89% year-over-year surge in Flower and only 0.88% year-over-year in Vapor Pens, suggests the brand’s near-term growth engine is moving toward inhalable plant formats, implying resource allocation should tilt toward Flower and Pre-Roll while using Concentrates leadership to maintain halo effects.
Competitive Landscape
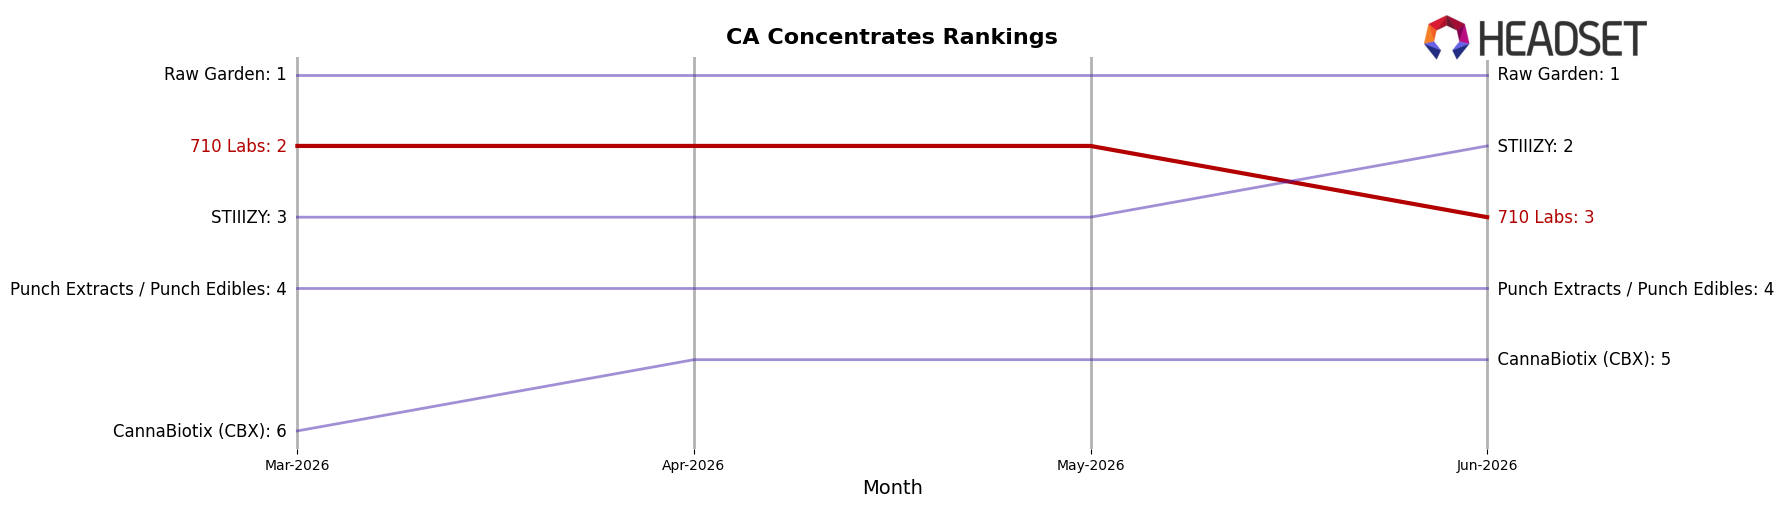
710 Labs sits at rank #3 in CA Concentrates in June 2026, improving 1 position from #4 year over year but slipping 1 spot from #2 three months ago; the brand previously peaked at #1 in June 2024, marking a 2-position drop from that peak to today. Competitively, Raw Garden held steady at #1 year over year while growing sales 7.0%, and STIIIZY maintained #2 with a 4.2% sales increase, whereas Punch Extracts / Punch Edibles fell from #3 to #4 alongside a 29.1% sales decline; this configuration places 710 Labs as a net gainer versus last year but a recent share donor versus the top two. The pattern implies 710 Labs is stabilizing in the upper tier with upward YoY momentum but requires near-term share capture to re-enter the top-two cohort.
Notable Products
The steepest decline came from Banana Rickscotti (Bulk), down 25.5% month over month and slipping to rank 10, while Lemon Tart Pucker #1 Pre-Roll fell 16.9% to rank 3, signaling pressure on value-oriented formats even as overall rank positions remain in the top ten. Donny Burger Pre-Roll grew 18.7% MoM to rank 6 versus the -16.9% slide at rank 3 for Lemon Tart Pucker #1 Pre-Roll, and four of the top ten are Pre-Roll SKUs, indicating a shift toward combustion convenience despite uneven trajectories. At the top of the board, C. Chrome #27 (7g) holds rank 1 and the Flower tier also includes rank 5 and rank 10 entries, but category dispersion shows Concentrates at rank 2 with a single SKU generating $61,575, pointing to a high-yield anchor outside Flower. Netting these moves together, the mix implies 710 Labs is leaning into Pre-Rolls for reach while relying on a flagship Concentrates SKU and selective Flower winners to stabilize revenue as bulk Flower volatility increases.
Top Selling Cannabis Brands
Data for this report comes from real-time sales reporting by participating cannabis retailers via their point-of-sale systems, which are linked up with Headset’s business intelligence software. Headset’s data is very reliable, as it comes digitally direct from our partner retailers. However, the potential does exist for misreporting in the instance of duplicates, incorrectly classified products, inaccurate entry of products into point-of-sale systems, or even simple human error at the point of purchase. Thus, there is a slight margin of error to consider. Brands listed on this page are ranked in the top twenty within the market and product category by total retail sales volume.

