May-2026
Sales
Trend
6-Month
Product Count
SKUs
Avg Price
YoY Sales Change
YoY Price Change
Market Insights Snapshot
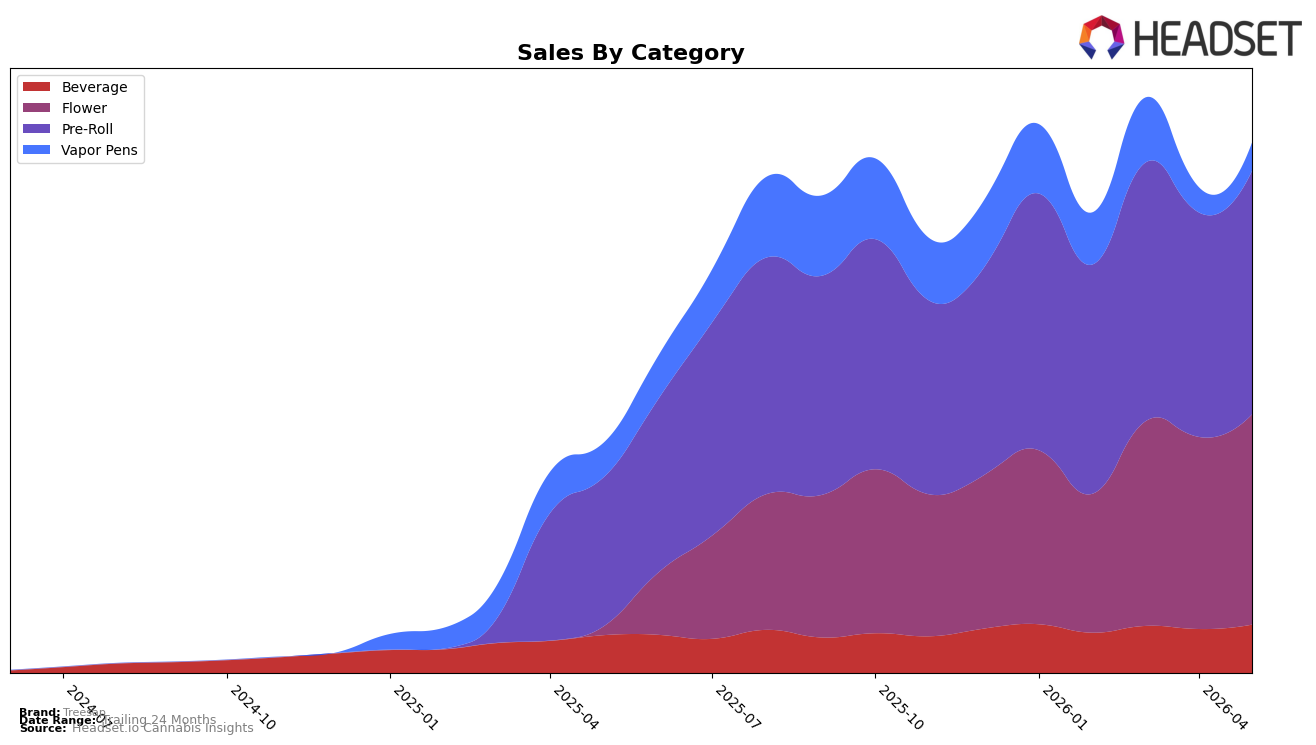
Treesap’s category mix in May 2026 concentrated in Pre-Roll at 45.92% share and Flower at 39.63% share, with Pre-Roll up 63.47% year over year and 8.45% month over month while Flower surged 2,384.76% year over year and 9.43% month over month. Beverage held 9.13% share with 27.85% year-over-year growth and 9.90% month-over-month growth, whereas Vapor Pens sat at 5.32% share with a -17.95% year-over-year decline despite a 12.12% month-over-month uptick. With brand-wide sales up 130.88% year over year and average price up 16.40%, the mix tilt toward Flower and Pre-Roll implies Treesap is scaling volume in inhalables where price points remain accessible (Pre-Roll average price $16.17) while premiumizing selectively in categories like Beverage at a $20.75 average ticket.
Positioning-wise, the combination of a 2,384.76% year-over-year spike in Flower alongside a 63.47% year-over-year climb in Pre-Roll, paired with double-digit month-over-month gains of 9.43% and 8.45% respectively, indicates Treesap is consolidating around two high-velocity inhalable pillars while de-emphasizing Vapor Pens after a -17.95% year-over-year contraction. The 44 rank in Pre-Roll within California, alongside a 12.12% month-over-month lift in Vapor Pens and a 9.90% month-over-month expansion in Beverage, suggests near-term share capture is more attainable in Pre-Roll and Flower where Treesap already commands 85.55% combined share of its own mix; the strategic implication is to convert Flower’s outsized year-over-year momentum into sustained shelf presence while using Beverage as a margin-accretive adjunct rather than a primary growth engine.
Competitive Landscape
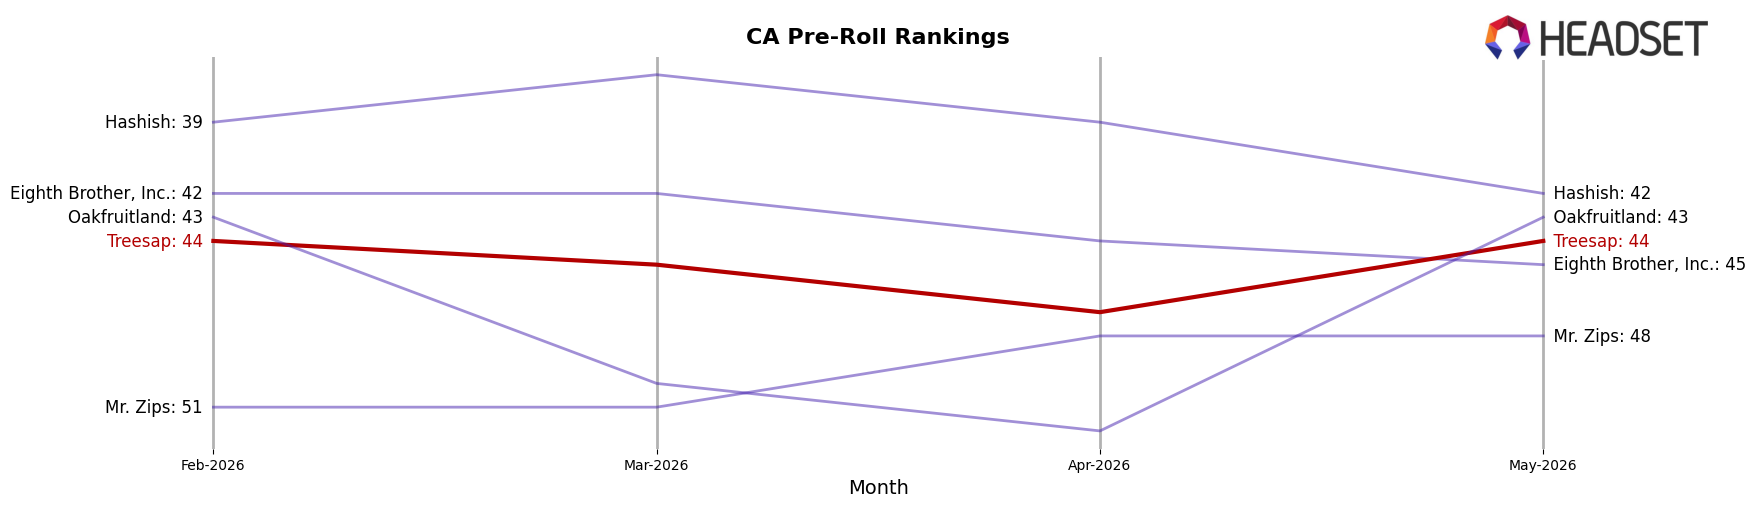
Treesap is ranked #44 in CA Pre-Roll in May 2026, improving 25 positions from #69 in May 2025, and matching its 3-month position at #44 while setting a peak rank of #44 in May 2026. Against top competitors, Jeeter held #1 year over year with a 0% rank change while posting a 25.90% sales YoY increase, and Presidential moved up one spot from #5 to #4 despite a -0.45% sales YoY change; by contrast, Treesap’s 25-rank YoY gain from #69 to #44 outpaced these steadier or marginal shifts in placement. This trajectory implies Treesap is converting rank volatility into upward mobility, positioning it to pressure mid-tier incumbents if it sustains rank within the #40–#45 band and narrows the gap to #35 within the next two to three months.
Notable Products
Gelato Pie (28g) delivered the clearest move in May 2026 with a month-over-month jump of 135.5% to $43,425 while taking rank 1, and Laser Guava Shake (28g) followed with an 83.0% MoM increase at rank 2. In contrast, Lemonosa Haze Pre-Roll 14-Pack (14g) fell 13.9% MoM to rank 6, marking the steepest decline among the top ten and creating a split between rising Flower and lagging Pre-Roll formats. Four of the top ten are Pre-Roll SKUs concentrated in 14-pack and 2-pack formats, yet Flower holds the top two ranks with triple- and double-digit MoM gains. The pattern implies Treesap is tilting toward higher-velocity Flower shakes while rationalizing underperforming Pre-Roll formats.
Top Selling Cannabis Brands
Data for this report comes from real-time sales reporting by participating cannabis retailers via their point-of-sale systems, which are linked up with Headset’s business intelligence software. Headset’s data is very reliable, as it comes digitally direct from our partner retailers. However, the potential does exist for misreporting in the instance of duplicates, incorrectly classified products, inaccurate entry of products into point-of-sale systems, or even simple human error at the point of purchase. Thus, there is a slight margin of error to consider. Brands listed on this page are ranked in the top twenty within the market and product category by total retail sales volume.

