Jun-2026
Sales
Trend
6-Month
Product Count
SKUs
Avg Price
YoY Sales Change
YoY Price Change
Market Insights Snapshot
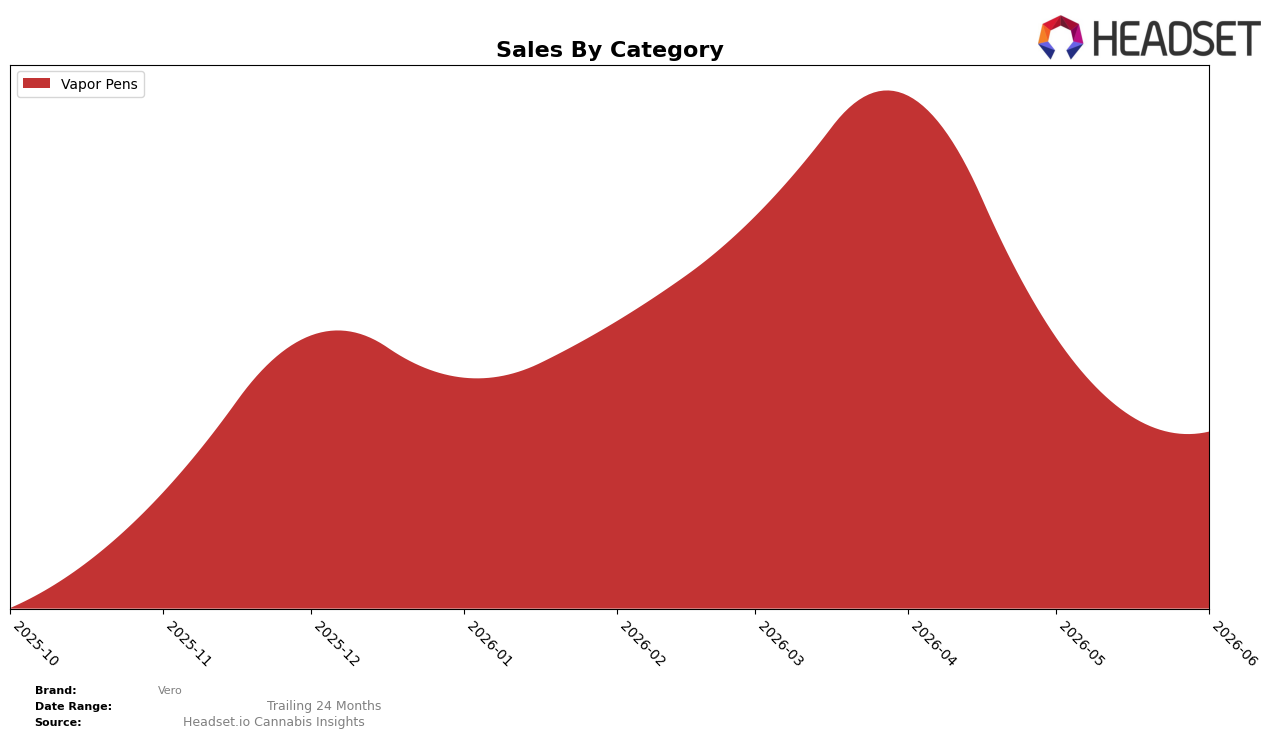
In June 2026, Vero’s category mix was fully concentrated in Vapor Pens at 100.0% share, while the same category registered a month-over-month sales change of -27.6% alongside a category rank of 17 in Alberta. The drop of 27.6% MoM against an unchanged 100.0% mix suggests volume contraction within a single-category dependency, and the rank position of 17 implies mid-pack placement rather than top-quartile momentum in June 2026.
The combination of a 100.0% single-category focus and a -27.6% MoM decline indicates positioning risk concentrated in Vapor Pens, where rank 17 leaves limited insulation against further share shifts in Alberta. With an average price of $33.55 and no offset from other categories, the June 2026 structure implies Vero must either extract efficiency within Vapor Pens or diversify to reduce volatility and improve rank trajectory from 17.
Competitive Landscape
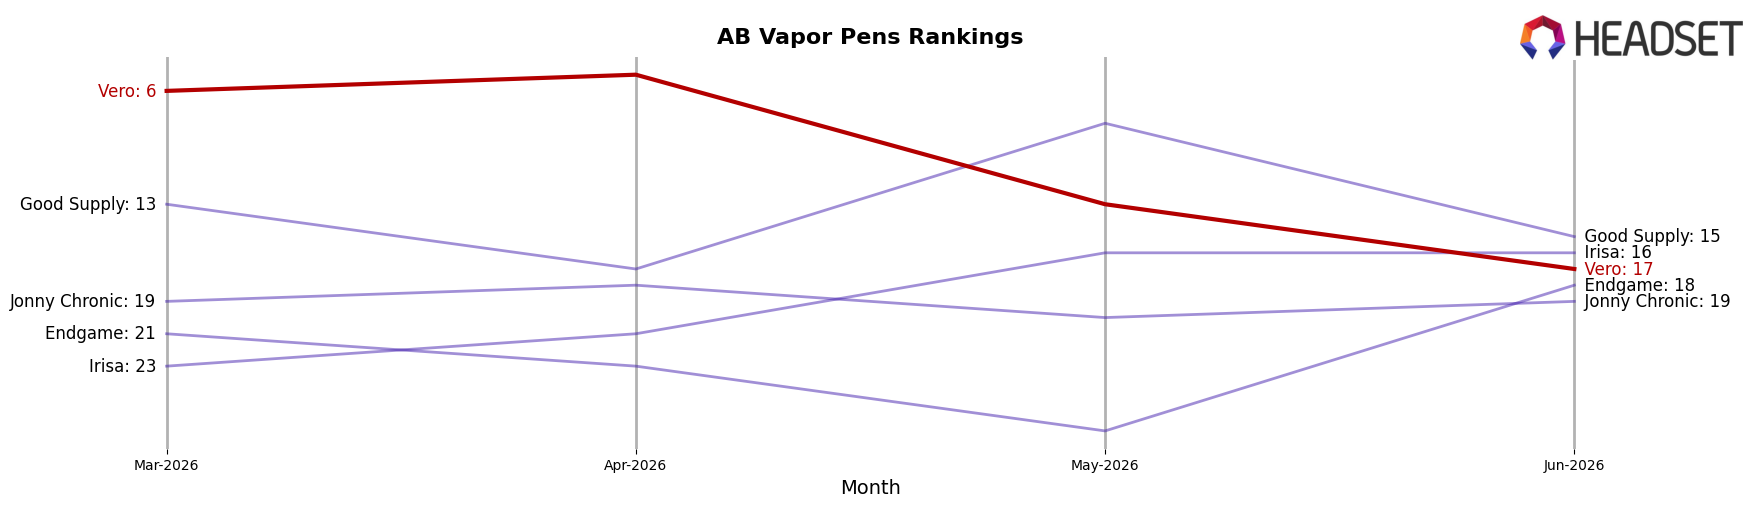
Vero sits at rank #17 in AB Vapor Pens in June 2026, falling 11 positions from rank #6 in March 2026 and retreating from its peak rank #5 in April 2026; in the same period, Spinach held #1 with a 43.97% year-over-year sales increase while Kolab advanced from #8 year-over-year to #4. The descent from #6 to #17 over three months contrasts with BoxHot maintaining #3 alongside a 12.02% year-over-year gain, and General Admission sliding year-over-year to #5 with a -14.82% sales change. The pattern implies Vero’s rank trajectory is being compressed by competitors that are either holding top positions or improving ranks as category growth concentrates at the top.
Notable Products
Peach Perfect Liquid Diamonds Postless Cartridge (1g) posted the steepest movement in June 2026 with a -52.9% month-over-month decline while holding rank 3, and Rocket Bomb Liquid Diamonds Postless Cartridge (1g) also slid -11.0% to rank 2. Jolly Farmer Liquid Diamonds Postless Cartridge (1g) remained at rank 1 despite a -6.3% drop, anchoring an assortment where all seven top products are Vapor Pens, and four of the top five fell at least -14.3% month over month. With the top-three ranks controlled by Vapor Pens and two of them declining double digits, the pattern implies Vero is concentrated in a single format that is overexposed to short-term volatility, signaling a need to rebalance mix rather than chase rank defense through price promotions as low as $118,873 in sales concentration at the top.
Top Selling Cannabis Brands
Data for this report comes from real-time sales reporting by participating cannabis retailers via their point-of-sale systems, which are linked up with Headset’s business intelligence software. Headset’s data is very reliable, as it comes digitally direct from our partner retailers. However, the potential does exist for misreporting in the instance of duplicates, incorrectly classified products, inaccurate entry of products into point-of-sale systems, or even simple human error at the point of purchase. Thus, there is a slight margin of error to consider. Brands listed on this page are ranked in the top twenty within the market and product category by total retail sales volume.

