Jun-2026
Sales
Trend
6-Month
Product Count
SKUs
Avg Price
YoY Sales Change
YoY Price Change
Market Insights Snapshot
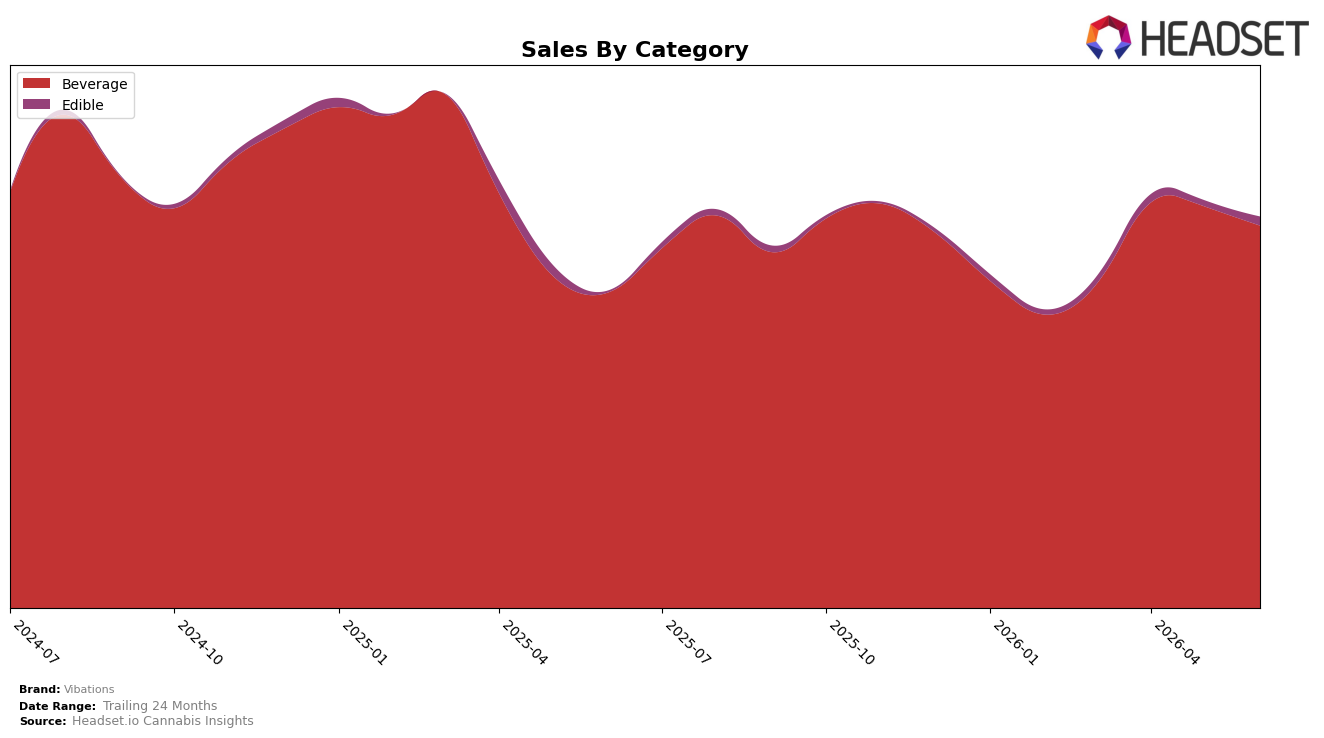
Vibations remains concentrated in Beverage at 97.35% share, where June 2026 year-over-year growth was 21.09% but month-over-month declined 4.75%, while Edible expanded to 2.65% share with 211.14% year-over-year and 39.49% month-over-month growth; the average price rose 2.89% YoY to $17.05, with Beverage priced at $16.95 and Edible at a 28.3% premium. The brand is ranked 3 in Beverage in Maryland, indicating category strength even as the MoM dip in the core suggests short-term deceleration; the mix shift and pricing spread imply Vibations is leveraging Edible as a growth vector while protecting Beverage volume.
The surge in Edible (up 211.14% YoY and 39.49% MoM) against a 4.75% MoM pullback in Beverage, combined with a 2.89% brand-wide price lift, implies Vibations is adding higher-priced SKUs to offset softness in the core and diversify revenue risk; with Beverage still at 97.35% share and rank 3 in Maryland, the near-term task is to convert Edible’s momentum into meaningful share without eroding Beverage rank. The pattern suggests a deliberate barbell: defending a top-3 Beverage position while scaling a premium-priced Edible line to sustain the 23.09% brand-level YoY growth despite a -11.22% two-year comparison.
Competitive Landscape
Vibations sits at #3 in MD Beverage in June 2026, improving 1 rank from #4 year over year, while holding flat versus March 2026 at #3; compared with competitors, Keef Cola held #1 year over year with 16.35% sales growth and Sunnies by SunMed stayed at #2 with 44.74% sales growth, whereas Dixie Elixirs slipped from #3 to #4 despite 2.07% growth. Vibations’ current #3 and year-over-year climb of one position, paired with a historical peak of #1 in February 2025 and competitors holding or losing positions, implies the brand has stabilized in a top-three slot but must outpace faster-growing #2 to regain upward momentum.

Notable Products
The steepest decline came from Strawberry Lemonade Liquid Drink Mix 10-Pack (100mg), down 35.26% while sitting at rank 3, as the top-ranked THC/THCV 2:1 Tropical Punch Drink Mix 10-Pack (100mg THC , 50mg THCV) also slipped 10.79%, indicating softness at both the premium and core ends. In contrast, CBD/THC 1:1 Half and Half Iced Tea Lemonade Powder Drink Mix 10-Pack (50mg CBD, 50mg THC) surged 56.90% to rank 5, while the 1:1 Liquid Drink Mix 10-Pack (100mg CBD, 100mg THC) at rank 2 fell 2.48%, showing mix-shift toward lower-dosage balance. With all ten top SKUs in Beverage and three Strawberry Lemonade variants occupying ranks 3, 7, and 10 alongside two THCV-forward entries at ranks 1 and 9, category concentration is high but flavor and formulation results are diverging; the pattern implies Vibations is pivoting toward functional, lower-dosage and THCV-inclusive formats rather than legacy flavor-led repeats.
Top Selling Cannabis Brands
Data for this report comes from real-time sales reporting by participating cannabis retailers via their point-of-sale systems, which are linked up with Headset’s business intelligence software. Headset’s data is very reliable, as it comes digitally direct from our partner retailers. However, the potential does exist for misreporting in the instance of duplicates, incorrectly classified products, inaccurate entry of products into point-of-sale systems, or even simple human error at the point of purchase. Thus, there is a slight margin of error to consider. Brands listed on this page are ranked in the top twenty within the market and product category by total retail sales volume.

