.svg)

Aug-2026
Sales
Trend
6-Month
Product Count
SKUs
Avg Price
YoY Sales Change
YoY Price Change


Where to Buy
Dixie Elixirs is stocked at 288 licensed dispensaries across Michigan, Maryland, and 5 other states, 152 of them in Michigan, with the deepest coverage in New Buffalo, Monroe, Detroit, Traverse City, and Kalamazoo. Search by ZIP code or city below to find the closest one, or filter by product type if you are after a specific format.
Market Insights Snapshot
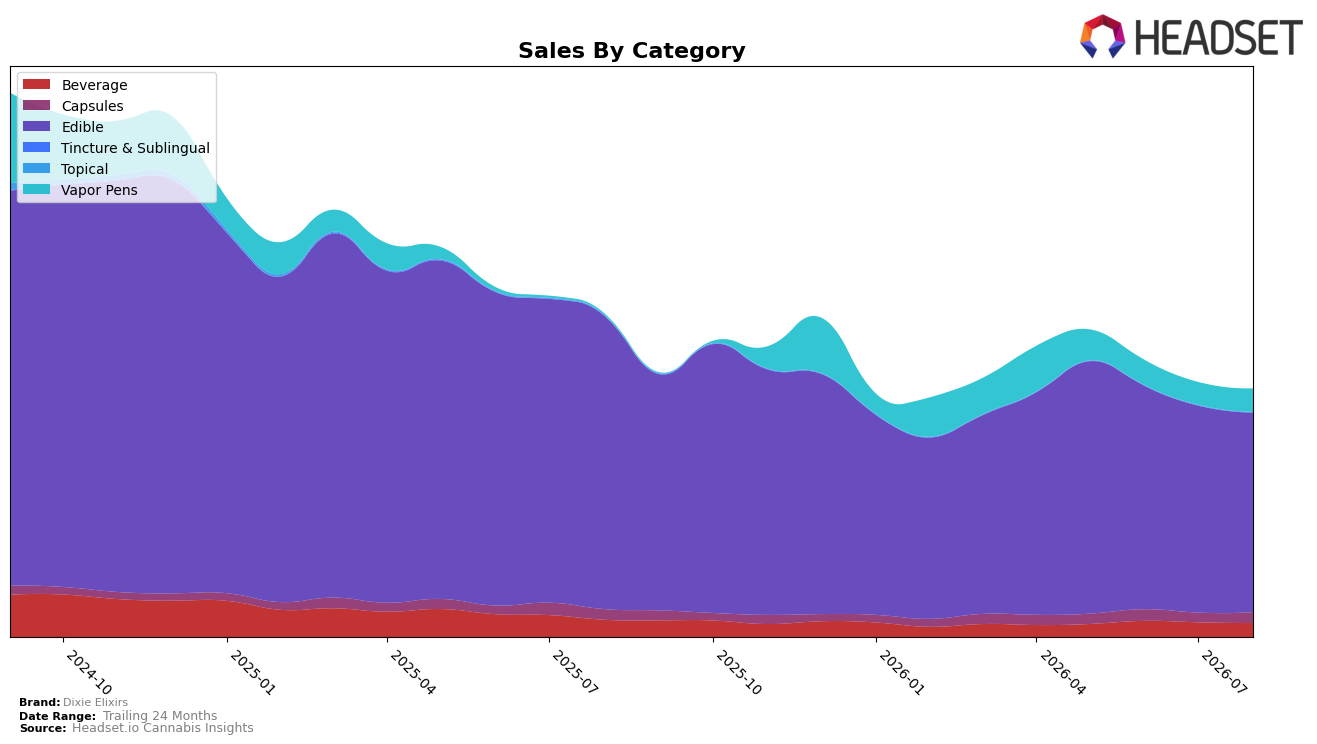
Dixie Elixirs concentrated 80.81% of August 2026 sales in Edible, where sales fell 32.05% year over year and 3.60% month over month, while Vapor Pens expanded to 9.36% share with a 1,708.05% year-over-year surge and a 2.60% month-over-month gain. Beverage held 5.60% share with sales down 18.84% year over year and 4.59% month over month, and Capsules reached 4.24% share with a 1.86% year-over-year lift and a 12.45% month-over-month increase. With brand-wide sales down 23.40% year over year alongside a 1.18% average price decline, and an Edible category rank of 14 in Maryland, the mix shift implies a pivot from a contracting Edible base toward emerging traction in Vapor Pens and Capsules.
The combination of a 1,708.05% year-over-year rise in Vapor Pens against a 32.05% decline in Edible indicates diversification that can reduce dependency on a single category and help offset cyclical Edible softness. The 12.45% month-over-month increase in Capsules, paired with a 2.60% month-over-month gain in Vapor Pens, contrasts with month-over-month declines of 3.60% in Edible and 4.59% in Beverage, implying that Dixie Elixirs is gaining incremental basket occasions in inhalable and dose-controlled formats while Beverage under-indexes; holding rank 14 in Edible in Maryland suggests near-term positioning gains will come more from non-Edible categories than from climbing the Edible ranking.
Competitive Landscape
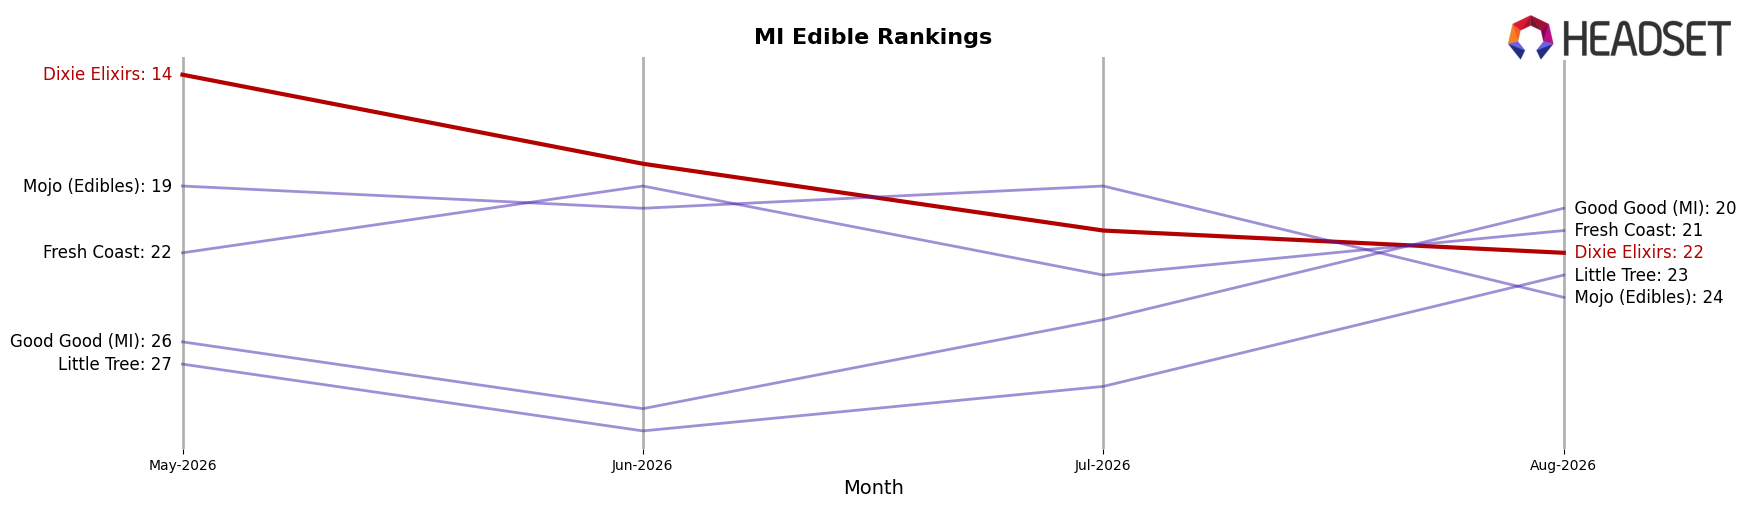
Dixie Elixirs is ranked #22 in Michigan Edible in August 2026, down 7 positions year over year from #15, and 8 positions below its three-month mark at #14; the brand is also 11 positions off its peak of #11 from October 2024. In contrast, Wyld held #1 both this year and last year despite a 22.9% year-over-year sales decline, while Play Cannabis climbed from #11 to #5 alongside a 22.8% sales increase; meanwhile, MKX Oil Company slipped from #3 to #4 with roughly flat sales at +0.3%. The combined pattern—rank erosion from #15 to #22 alongside competitors either maintaining top spots or moving up—implies Dixie Elixirs is losing relative velocity in shelf competition and must reverse share loss to re-enter the top 15.
Notable Products
Sour Smash Gummies 10-Pack (200mg) posted the steepest decline at -27.8% while sliding to rank 6, and Sativa Citrus Blast Gummies 10-Pack (200mg) fell -11.7% at rank 3, indicating that higher-dosage non-functional SKUs lost momentum even as overall category rank positions stayed concentrated at the top five. In contrast, CBN/CBD/THC 2:1:1 Synergy Sleepberry Gummies 10-Pack (100mg CBN, 50mg CBD, 50mg THC) rose +43.5% to rank 1 and THC/CBN/CBD 2:1:1 Synergy Cherry Chill Gummies 10-Pack (200mg THC, 100mg CBN, 100mg CBD) grew +5.8% at rank 2, so functional, multi-cannabinoid formats gained share against traditional fruit SKUs. With eight of the top ten SKUs in August 2026 clustering under flavored gummy variants across dosage tiers and one leading item generating $96,287, the mix now tilts toward sleep and multi-cannabinoid benefits rather than simple flavor-led offerings.
Top Selling Cannabis Brands






Data for this report comes from real-time sales reporting by participating cannabis retailers via their point-of-sale systems, which are linked up with Headset’s business intelligence software. Headset’s data is very reliable, as it comes digitally direct from our partner retailers. However, the potential does exist for misreporting in the instance of duplicates, incorrectly classified products, inaccurate entry of products into point-of-sale systems, or even simple human error at the point of purchase. Thus, there is a slight margin of error to consider. Brands listed on this page are ranked in the top twenty within the market and product category by total retail sales volume.

