.svg)
Sep-2026
Sales
Trend
6-Month
Product Count
SKUs
Avg Price
YoY Sales Change
YoY Price Change


Where to Buy
Sunnies by SunMed is stocked at 90 licensed dispensaries across Maryland, with the deepest coverage in Baltimore, Silver Spring, Annapolis, Columbia, and Frederick. Search by ZIP code or city below to find the closest one, or filter by product type if you are after a specific format.
Market Insights Snapshot
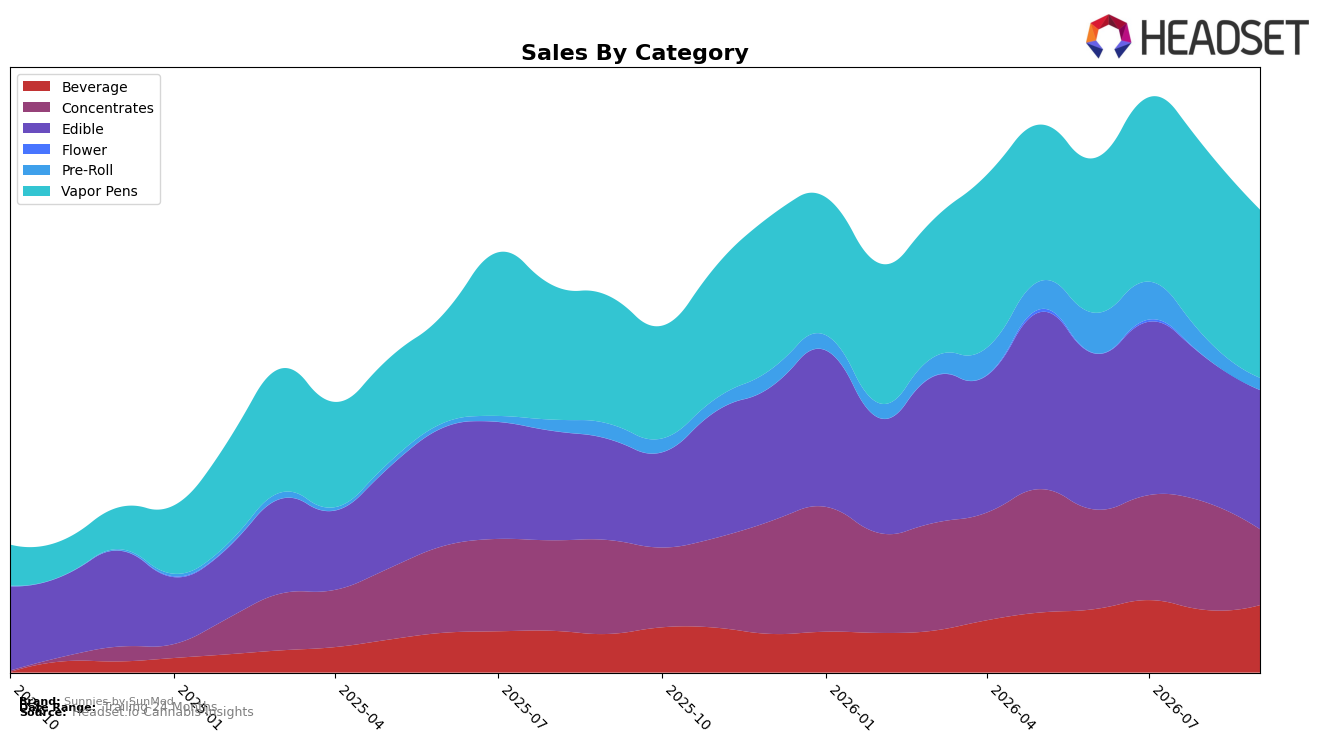
In September 2026, Sunnies by SunMed’s mix tilted toward Vapor Pens at 36.38% share with year-over-year growth of 31.56% but a month-over-month decline of 11.22%, while Edible held 30.07% share with 37.81% YoY growth and a 4.06% MoM dip. Beverage expanded to 14.58% share with 74.91% YoY growth and a 7.60% MoM lift, contrasting with Concentrates at 16.39% share suffering a 19.23% YoY decline and a 29.76% MoM drop. Pre-Roll contracted to 2.59% share with a 20.78% YoY decline and a 39.22% MoM fall. With overall brand sales up 22.91% YoY and average price down 11.45% YoY, the pattern implies Sunnies by SunMed is leaning into lower-priced, faster-turning formats while pulling back from higher-variance inhalables month to month.
These shifts reposition Sunnies by SunMed toward accessible entry points and everyday use occasions: Beverage’s 7.60% MoM gain and 74.91% YoY growth offset Vapor Pens’ 11.22% MoM pullback despite a 31.56% YoY rise, while Edible’s 37.81% YoY growth stabilizes volume as Concentrates’ 29.76% MoM and 19.23% YoY declines compress premium extract exposure. In Maryland Vapor Pens, a rank of 15 paired with a 31.56% YoY gain but double‑digit MoM decline suggests mid‑pack positioning that benefits from broad demand but is price-sensitive and promo-dependent; the brand’s 11.45% YoY price decrease combined with mix shifts implies a deliberate trade‑down defense to widen basket reach without overextending in volatile segments.
Competitive Landscape
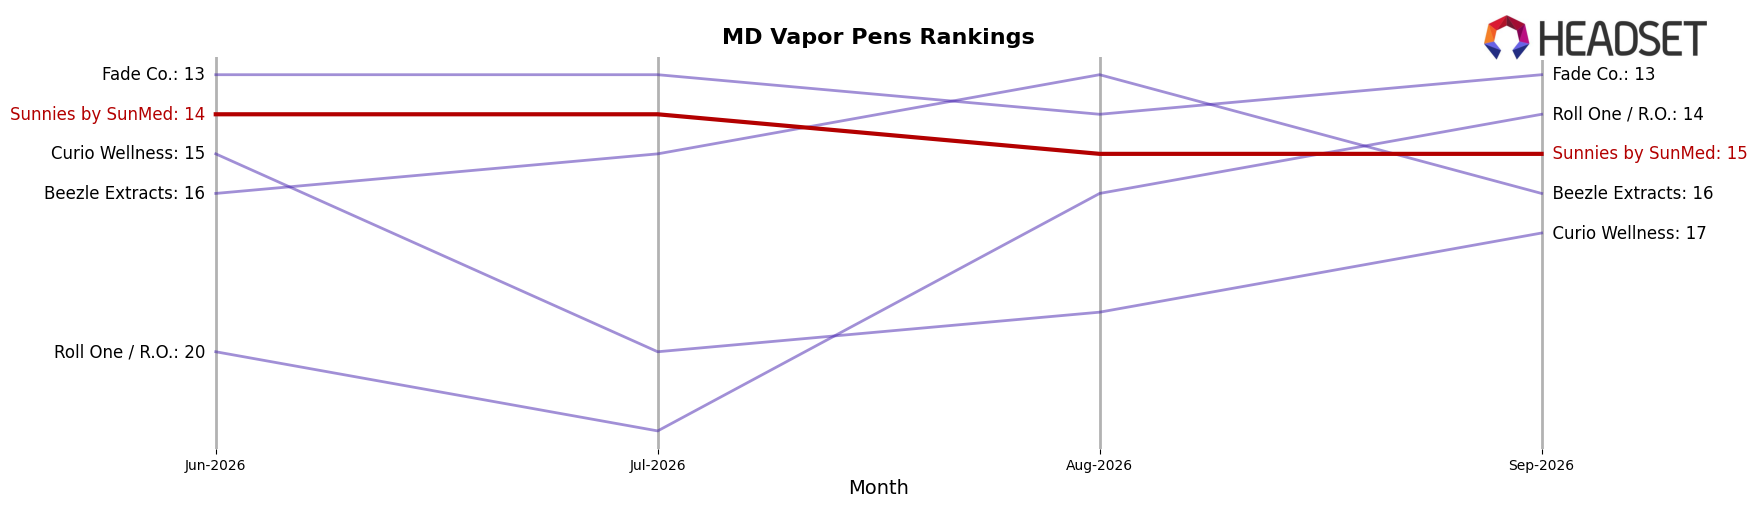
Sunnies by SunMed sits at rank #15 in MD Vapor Pens in September 2026, improving 4 positions from #19 year over year and slipping 1 position from #14 three months ago; the brand also matched its peak at #14 in July 2026, indicating near-term stagnation after mid-year momentum. In directional context, Select held #1 with a 34.1% YoY sales lift while Sunnies by SunMed remained outside the top 10, and Rove advanced from #8 to #5 alongside a 121.3% YoY sales increase, outpacing Sunnies by SunMed’s rank progress. The pattern implies Sunnies by SunMed is improving relative to last year but ceding ground versus faster-climbing leaders, so maintaining top-15 status without reaccelerating likely anchors it to mid-tier share rather than a move into the top 10.
Notable Products
No 01- Sweet Orange & Lemon Lime Fizz Mocktail (10mg) posted the largest movement in September 2026 with a 52.2% MoM surge and climbed to rank 6, while Golden Pineapple Live Resin Gummies 10-Pack (100mg) fell 29.2% MoM to rank 9, marking the steepest decline. Socials - Black Cherry Infused Sparkling Water (10mg) inched up 7.8% MoM to hold rank 1, and Socials - Peach Infused Sparkling Water 4-Pack (40mg) slipped 6.6% MoM to rank 2, indicating gains in single-can offerings versus modest softness in multipacks. With seven of the top ten SKUs in Beverage and Socials - Bright Grapefruit & Lemon Lime Fizz Mocktail (10mg THC, 355ml) up 33.9% MoM at rank 8, beverages concentrated share and momentum while Edible volatility at rank 9 and rank 10 suggests portfolio focus is tilting toward ready-to-drink formats.
Top Selling Cannabis Brands






Data for this report comes from real-time sales reporting by participating cannabis retailers via their point-of-sale systems, which are linked up with Headset’s business intelligence software. Headset’s data is very reliable, as it comes digitally direct from our partner retailers. However, the potential does exist for misreporting in the instance of duplicates, incorrectly classified products, inaccurate entry of products into point-of-sale systems, or even simple human error at the point of purchase. Thus, there is a slight margin of error to consider. Brands listed on this page are ranked in the top twenty within the market and product category by total retail sales volume.

