.svg)

Sep-2026
Sales
Trend
6-Month
Product Count
SKUs
Avg Price
YoY Sales Change
YoY Price Change


Market Insights Snapshot
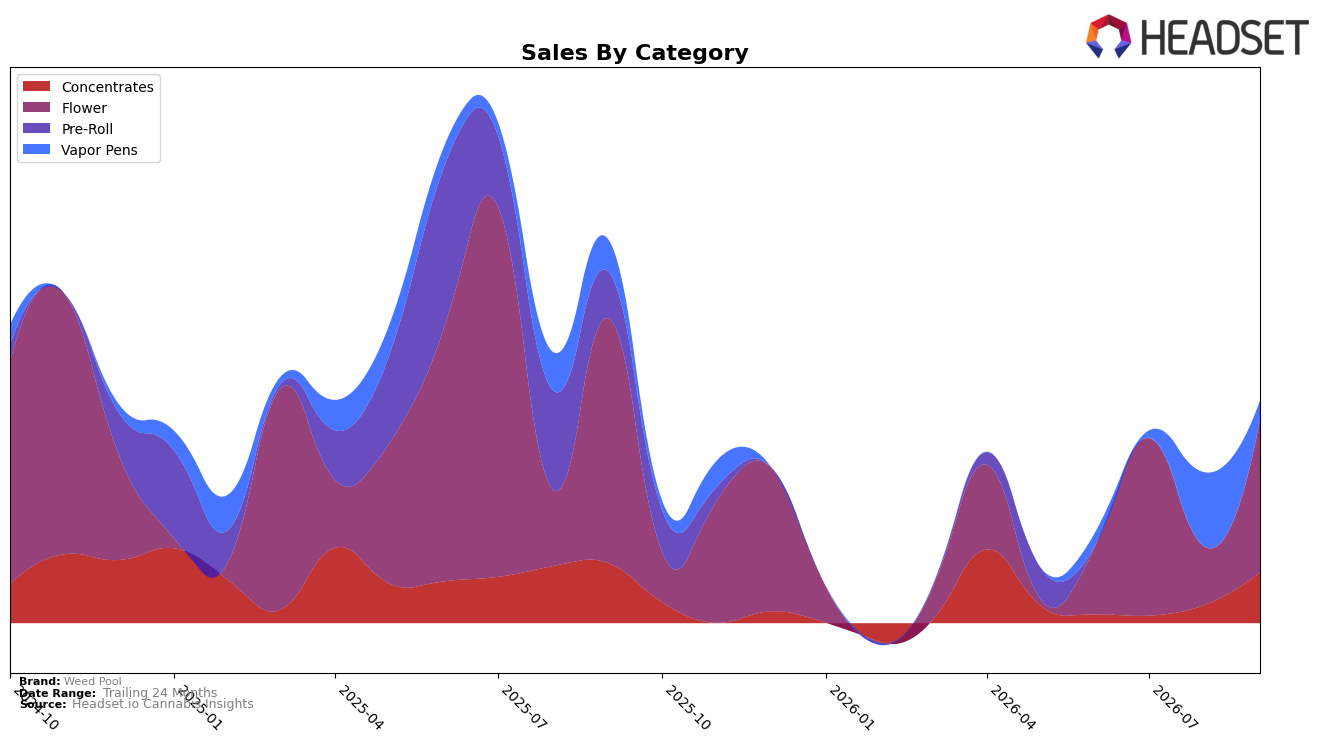
Weed Pool’s category mix in September 2026 tilted further toward Flower at 68.76% share, even as Flower posted a -37.78% year-over-year change and a 162.95% month-over-month rebound, while Concentrates reached 22.79% share with -15.67% year-over-year and 180.82% month-over-month changes. Vapor Pens fell to 8.45% share with -41.70% year-over-year and -74.62% month-over-month shifts, coinciding with a -21.02% year-over-year decline in average price and a -42.19% year-over-year contraction in total brand sales; this pattern implies Weed Pool is consolidating volume in lower-priced inhalable formats, led by a rapid restocking or promotional bounce in Flower and Concentrates rather than sustained penetration in Vapor Pens.
With Flower ranked 46 in Saskatchewan and holding 68.76% mix alongside a -37.78% year-over-year change, and Concentrates climbing month-over-month by 180.82% as Vapor Pens dropped -74.62% month-over-month, the brand’s positioning skews toward value-led inhalables where price elasticity is high. Given the -37.88% 24-month sales shift and a -21.02% year-over-year average price move against a 162.95% month-over-month Flower surge, the implication is a tactical pivot toward depth in core Flower and Concentrates to defend shelf presence in Saskatchewan, accepting rank pressure in premium-leaning Vapor Pens to stabilize share through volume-driven promotions.
Competitive Landscape
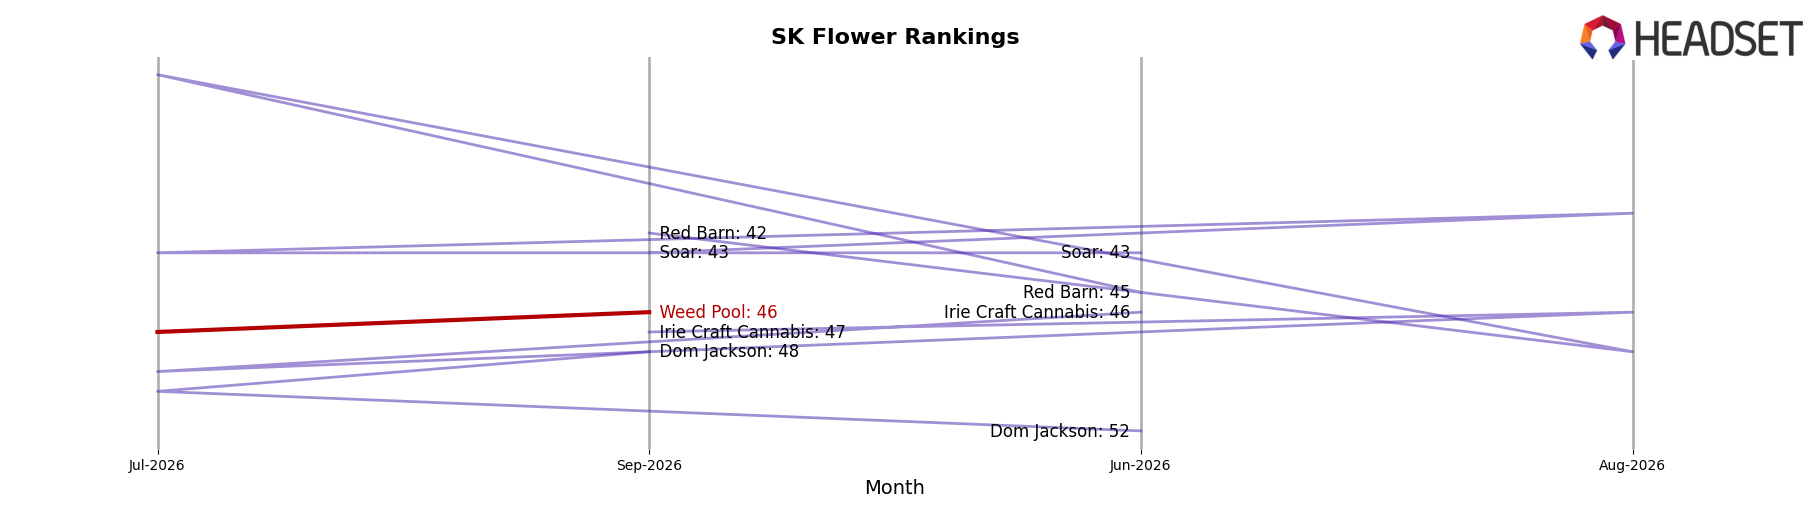
Weed Pool sits at rank #46 in SK Flower in September 2026, down 4 positions year over year from #42 and yet up 15 positions versus June 2026 when it was #61; meanwhile, the category’s leaders moved in the opposite direction, with Spinach climbing from #5 to #2 alongside a 60.16% year-over-year sales gain and Big Bag O' Buds rising from #6 to #3 with a 47.39% lift, while Good Supply slipped from #3 to #4 despite a 4.93% increase; against that context, Weed Pool’s decline from its July 2025 peak at #30 to #46 today—paired with a quarter-on-quarter rank improvement of 24.6%—signals a brand stabilizing in the lower mid-tier rather than regaining prior peak positioning, implying near-term share defense over share capture even if monthly revenue ticked up modestly.
Notable Products
Cola Burst Live Diamond Cartridge (1g) fell 74.6% month over month to rank 3 in September 2026, even as Orange Dreamsicle (7g) surged 193.0% to rank 1. El Gordo Traditional Hash (2g) also jumped 180.9% to rank 2, while Mango Cream (7g) rose 35.8% at rank 4, concentrating momentum in Flower and Concentrates while Vapor Pens contracted. With Flower holding 2 of the top 4 ranks and one SKU exceeding $14,700, the mix points to Weed Pool leaning into larger-format Flower and heritage Concentrates while de-emphasizing volatile Vape SKUs.
Top Selling Cannabis Brands






Data for this report comes from real-time sales reporting by participating cannabis retailers via their point-of-sale systems, which are linked up with Headset’s business intelligence software. Headset’s data is very reliable, as it comes digitally direct from our partner retailers. However, the potential does exist for misreporting in the instance of duplicates, incorrectly classified products, inaccurate entry of products into point-of-sale systems, or even simple human error at the point of purchase. Thus, there is a slight margin of error to consider. Brands listed on this page are ranked in the top twenty within the market and product category by total retail sales volume.

