.svg)

Sep-2026
Sales
Trend
6-Month
Product Count
SKUs
Avg Price
YoY Sales Change
YoY Price Change


Where to Buy
MyHi is stocked at 81 licensed dispensaries across New York and New Jersey, 63 of them in New York, with the deepest coverage in New York, Rochester, Binghamton, Brooklyn, and Albany. Search by ZIP code or city below to find the closest one, or filter by product type if you are after a specific format.
Market Insights Snapshot
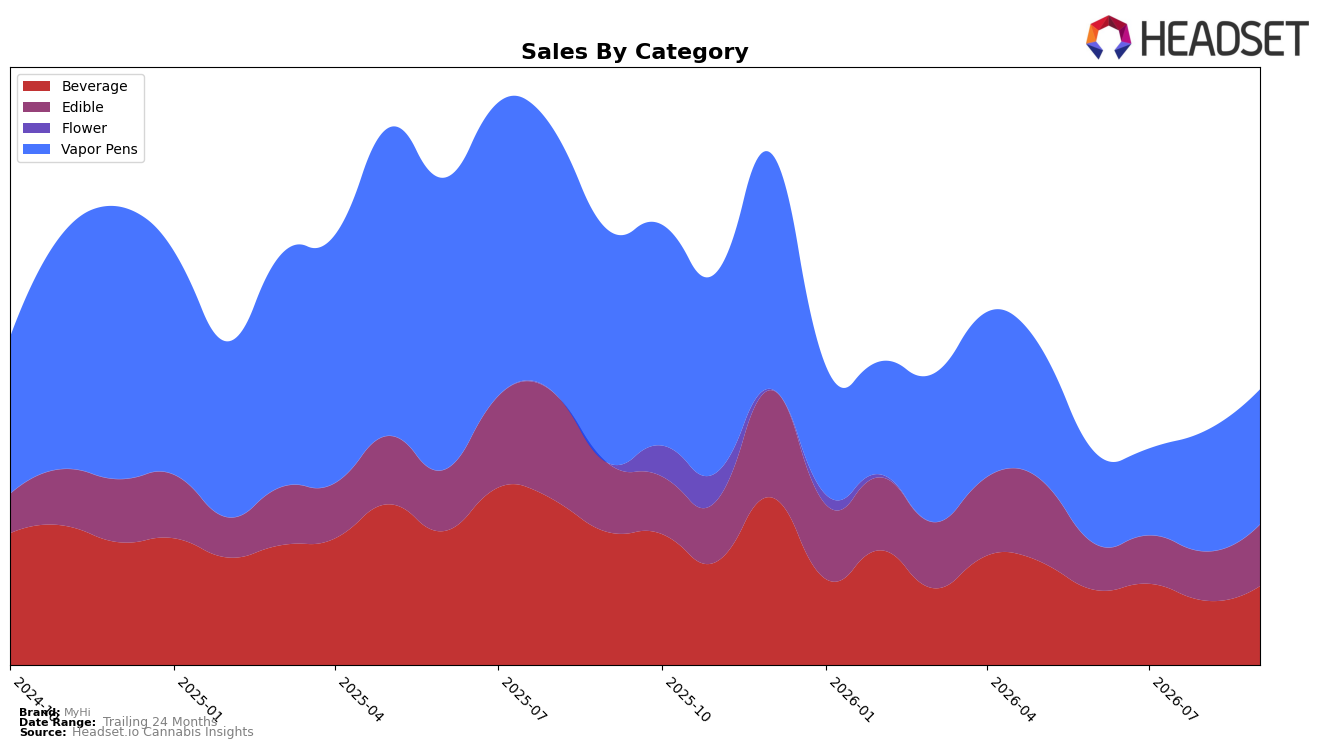
MyHi concentrated 49.06% of September 2026 sales in Vapor Pens with a year-over-year decline of 42.10% but a month-over-month rise of 12.43%, while Beverage held 28.66% with a 40.64% year-over-year drop and a 22.52% month-over-month lift, and Edible reached 22.28% with a 10.63% year-over-year decrease and a 25.55% month-over-month gain. Despite the brand-level year-over-year contraction of 36.69% alongside an average price down 0.08%, the simultaneous month-over-month increases across all three categories indicate a mix shift toward quicker-recovering ingestibles, implying that September 2026 momentum is being led by Edible and Beverage even as Vapor Pens remains the largest share.
In New York Vapor Pens, MyHi stood at rank 96, and with Vapor Pens down 42.10% year-over-year versus Edible down 10.63%, the brand’s reliance on a lower-ranked, faster-declining anchor category raises exposure to competitive displacement while the 25.55% month-over-month Edible lift and 22.52% Beverage lift suggest traction where smaller baskets and lower average prices dominate. The pattern implies a positioning pivot: maintain Vapor Pens presence for scale while reallocating attention toward Edible and Beverage where sequential growth outpaces the 12.43% month-over-month pen recovery and could dilute vulnerability associated with a rank in the 90s.
Competitive Landscape
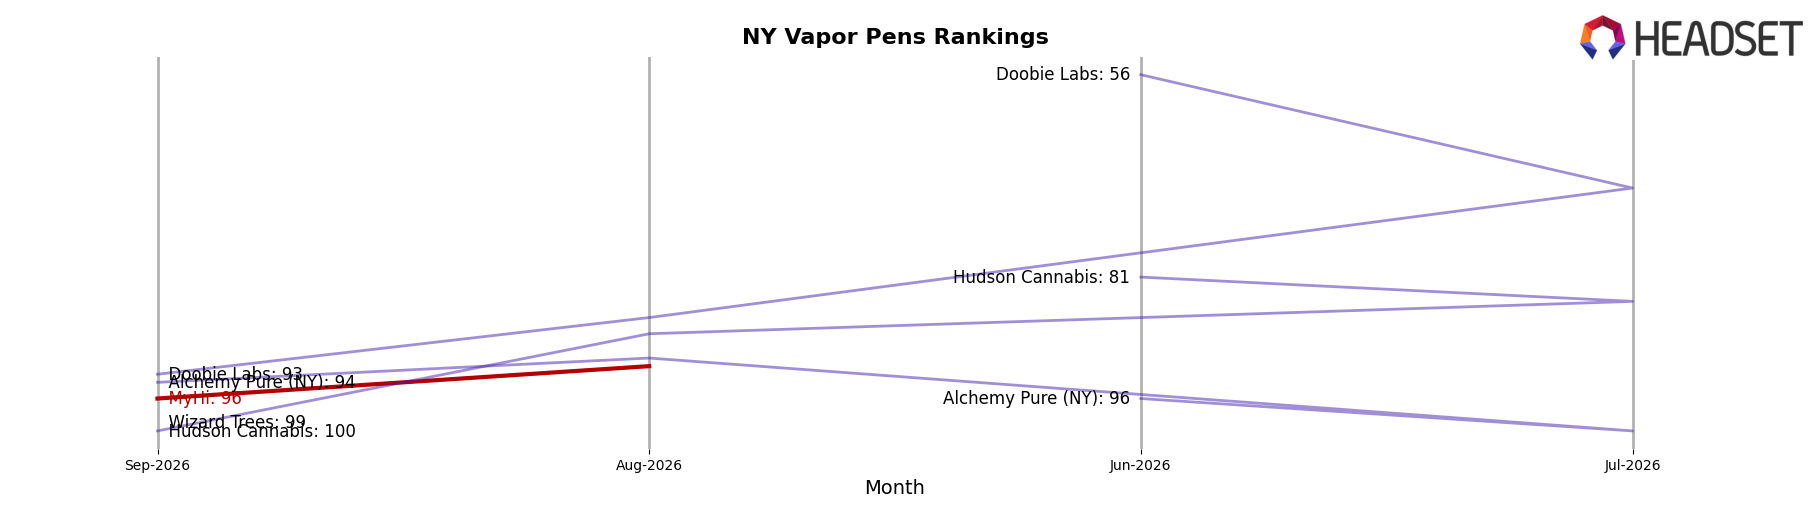
MyHi sits at rank #96 in NY Vapor Pens in September 2026, down 44 places year over year from #52, and just 6 places better than June–August’s three‑month position of #102; in contrast, peak rank was #45 in June 2025, a 51‑place gap from today that frames a multi‑quarter slide. Against leaders, Fernway advanced to #1 from #3 while growing sales 18.1% year over year, and Jetty Extracts surged to #5 from #28 with 289.4% YoY sales growth, signaling that momentum is consolidating at the top as MyHi drifts from mid‑tier to tail. The pattern implies MyHi’s rank trajectory is deteriorating relative to accelerating incumbents, making a near‑term return toward the #45 peak unlikely without a step‑change in share capture.
Notable Products
THC/CBD 1:1 Relax Indica Grape Live Rosin Gummies 10-Pack (100mg THC, 100mg CBD) delivered the standout move with an 81.9% month-over-month surge to rank 1, while THC/CBD 2:1 Super Tangerine Gummies 10-Pack (100mg THC, 50mg CBD) slid 16.4% to rank 9. Simply Flavorless Stir Stick 10-Pack (100mg) rose 31.0% at rank 3 as CBD/THC 1:3 Sour Diesel Live Rosin Disposable (1g) dipped 6.2% at rank 8, and four of the top ten are Edible SKUs, indicating a tilt toward ingestibles over inhalables. This pattern implies MyHi is concentrating demand into value-forward 1:1 and 2:1 edible formats while vapor pens stabilize in mid-table ranks, nudging assortment priorities toward flavor-led gummies and away from lower-momentum vape variants.
Top Selling Cannabis Brands






Data for this report comes from real-time sales reporting by participating cannabis retailers via their point-of-sale systems, which are linked up with Headset’s business intelligence software. Headset’s data is very reliable, as it comes digitally direct from our partner retailers. However, the potential does exist for misreporting in the instance of duplicates, incorrectly classified products, inaccurate entry of products into point-of-sale systems, or even simple human error at the point of purchase. Thus, there is a slight margin of error to consider. Brands listed on this page are ranked in the top twenty within the market and product category by total retail sales volume.

