.svg)

Jul-2026
Sales
Trend
6-Month
Product Count
SKUs
Avg Price
YoY Sales Change
YoY Price Change


Where to Buy
West Coast Trading Co. is stocked at 34 licensed dispensaries across California, with the deepest coverage in San Diego, Santa Rosa, Lake Elsinore, Riverside, and Santa Ana. Search by ZIP code or city below to find the closest one, or filter by product type if you are after a specific format.
Market Insights Snapshot
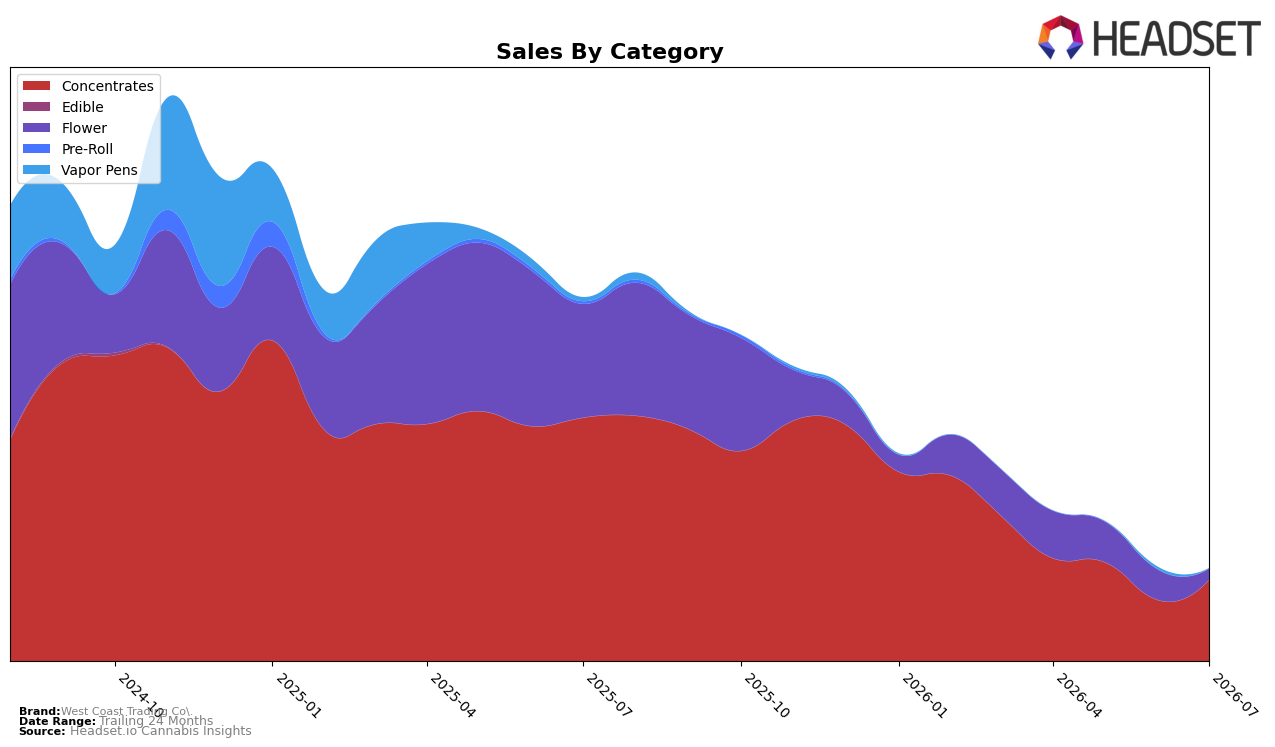
In July 2026, West Coast Trading Co.’s mix concentrated into Concentrates at 88.15% share with a 33.13% month-over-month lift, while Flower fell to 11.85% share with a -63.93% month-over-month decline; year-over-year, Concentrates dropped -66.70% and Flower contracted -90.41%. The average price declined -15.11% year-over-year to $11.88, with Concentrates averaging 11.23 and Flower at 20.93, implying a shift toward lower-price-point units as total brand sales fell -74.70% year-over-year. The brand’s rank in Concentrates in California sits at 36, signaling mid-pack presence even as the category mix consolidates; taken together, the mix skew and pricing drop indicate the portfolio is leaning into price-accessible Concentrates while deprioritizing Flower.
The combination of a 33.13% month-over-month gain in Concentrates against a -63.93% month-over-month contraction in Flower, alongside a -66.70% versus -90.41% year-over-year split, points to a defensive repositioning around a single category where rank 36 in California provides baseline visibility. With Concentrates at 88.15% share and Flower at 11.85% share, the -15.11% year-over-year average price move suggests reliance on lower-price pack sizes or promotions to retain velocity, which compresses revenue as overall sales are down -74.70% year-over-year. The pattern implies West Coast Trading Co. is trading breadth for depth: concentrating on Concentrates to stabilize monthly throughput while accepting reduced presence in Flower, a stance that can sustain placement at rank 36 but limits cross-category reach.
Competitive Landscape
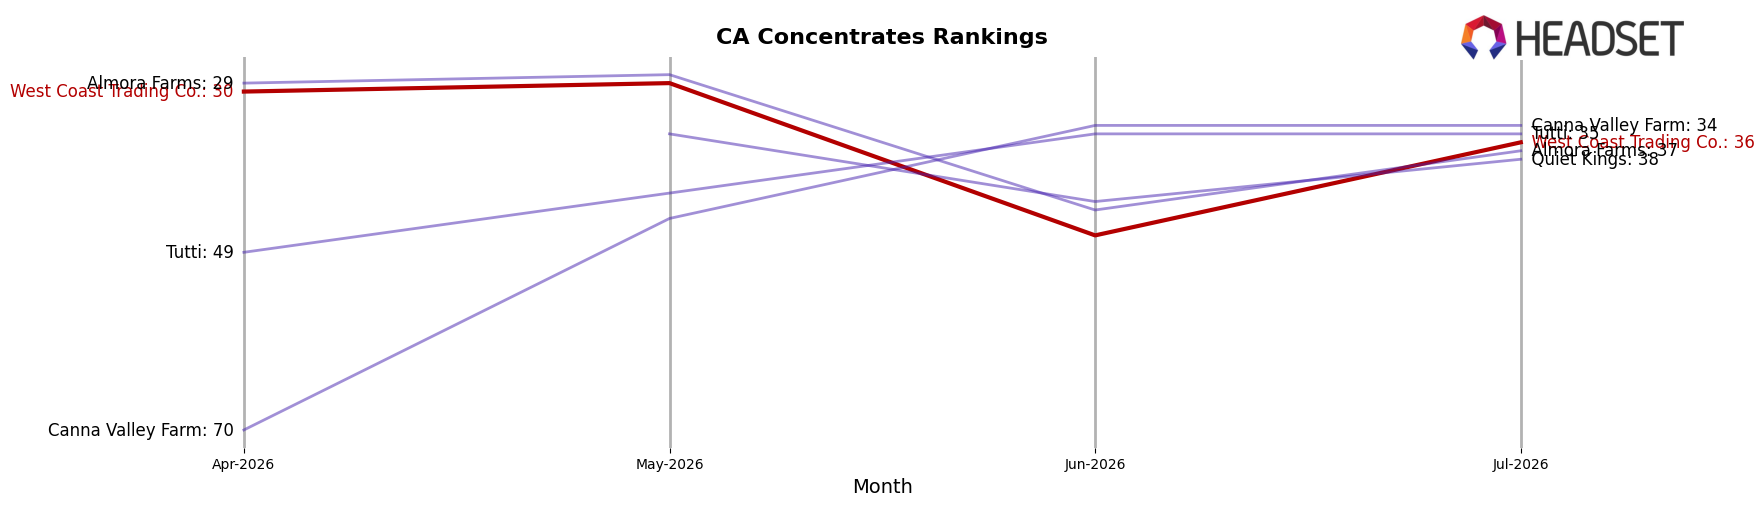
West Coast Trading Co. sits at rank #36 in CA Concentrates in July 2026 after a year-over-year slide from #14, a 22-place drop, and it also fell 6 spots from #30 three months ago, pointing to a multi-quarter downtrend despite a historical peak at #9 in November 2024. In contrast, Raw Garden held #1 year-over-year and remains #1 currently while growing sales 14.2%, and 710 Labs improved from #4 to #3 alongside 15.9% sales growth, whereas Punch Extracts / Punch Edibles slipped from #3 to #4 with a 21.1% sales decline, indicating that West Coast Trading Co.’s rank erosion is less about category-wide pressure and more about losing relative momentum to rising or stable leaders.
Notable Products
Permanent Cherry Badder (1g) posted the standout move in July 2026 with +313% month-over-month and a jump to rank 1, while Fire Junky Badder (1g) followed at +279% MoM at rank 2, signaling a sharp reordering at the top. Sherbanger Badder (1g) rose a more measured +30% MoM at rank 3, and eight of the top ten are Concentrates, concentrating revenue in a single form factor and pointing to a deliberate tilt toward extract-led velocity. The concentration of gains in the top two SKUs paired with a moderate +30% in the third spot implies a power-law curve where flagship Badders drive most of the lift, steering West Coast Trading Co. toward deeper specialization in high-turn concentrate sublines.
Top Selling Cannabis Brands






Data for this report comes from real-time sales reporting by participating cannabis retailers via their point-of-sale systems, which are linked up with Headset’s business intelligence software. Headset’s data is very reliable, as it comes digitally direct from our partner retailers. However, the potential does exist for misreporting in the instance of duplicates, incorrectly classified products, inaccurate entry of products into point-of-sale systems, or even simple human error at the point of purchase. Thus, there is a slight margin of error to consider. Brands listed on this page are ranked in the top twenty within the market and product category by total retail sales volume.

