.svg)

Sep-2026
Sales
Trend
6-Month
Product Count
SKUs
Avg Price
YoY Sales Change
YoY Price Change


Where to Buy
Greenline (CA) is stocked at 226 licensed dispensaries across California, New York, and Minnesota, 223 of them in California, with the deepest coverage in Los Angeles, San Jose, Santa Rosa, San Francisco, and Sacramento. Search by ZIP code or city below to find the closest one, or filter by product type if you are after a specific format.
Market Insights Snapshot
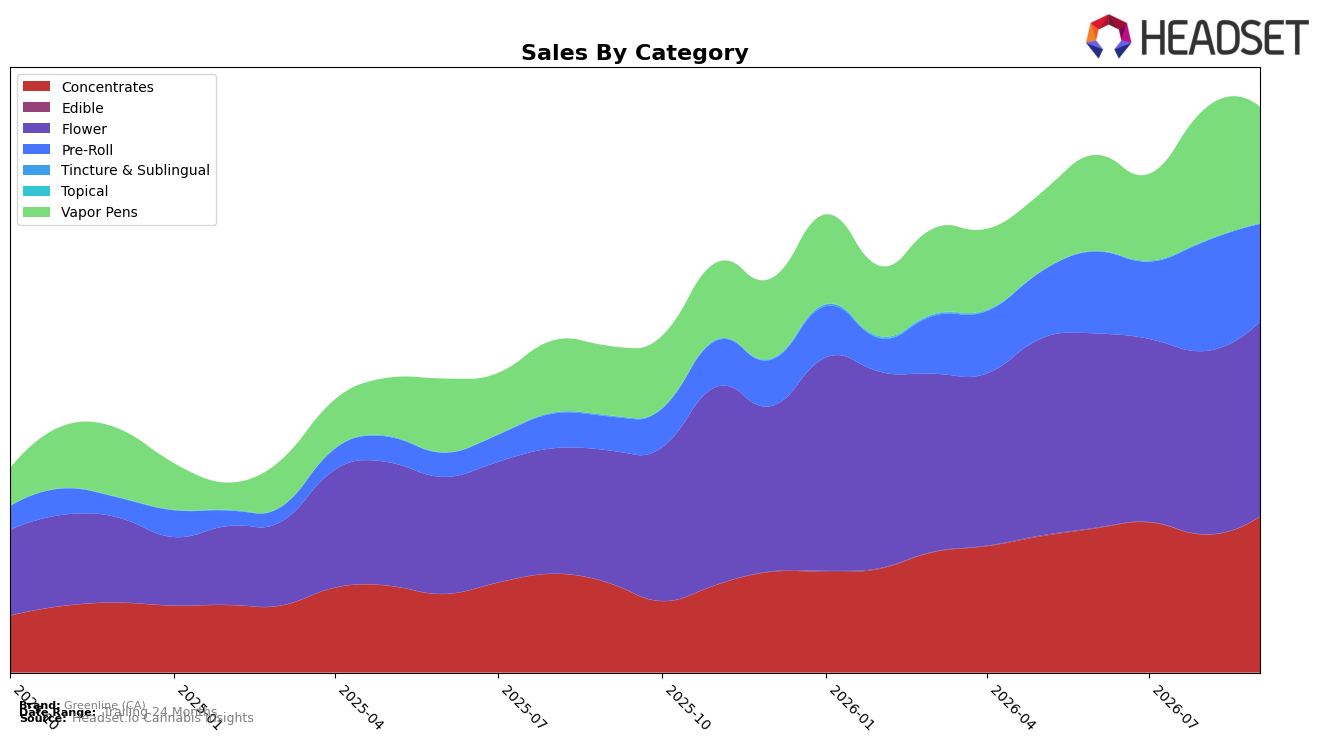
In September 2026, Greenline (CA) concentrated 34.40% of sales in Flower with 46.92% year-over-year growth and 6.11% month-over-month, while Concentrates held 27.60% share with 74.09% YoY and 13.07% MoM. Vapor Pens accounted for 20.59% share but declined 11.67% MoM despite 68.15% YoY growth, and Pre-Roll at 17.30% share surged 189.11% YoY while slipping 10.58% MoM. Niche formats swung at the margins: Topical rose 303.81% YoY but fell 29.05% MoM at 0.07% share, and Edible reached 0.04% share on 127.43% MoM with no YoY baseline. With overall brand sales up 73.48% YoY alongside a 13.61% YoY decrease in average price to $13.88, the pattern implies mix-driven volume expansion anchored in Flower and Concentrates, offset by tactical pullbacks in Vapor Pens and Pre-Roll.
The category shifts reposition Greenline (CA) toward value-forward inhalables: Concentrates’ 13.07% MoM gain versus Vapor Pens’ 11.67% MoM decline and Pre-Roll’s 10.58% MoM decline suggests consumer trade-down within inhalables rather than away from them, reinforced by the 13.61% YoY price reduction. Given a 52 rank in Flower within California and a 6.11% MoM lift in that category against a 20.59% pen share contraction, the implication is to lean into Flower and Concentrates to capture price-sensitive volume while using selective pricing or bundle tactics in Vapor Pens and Pre-Roll to stabilize monthly variability.
Competitive Landscape
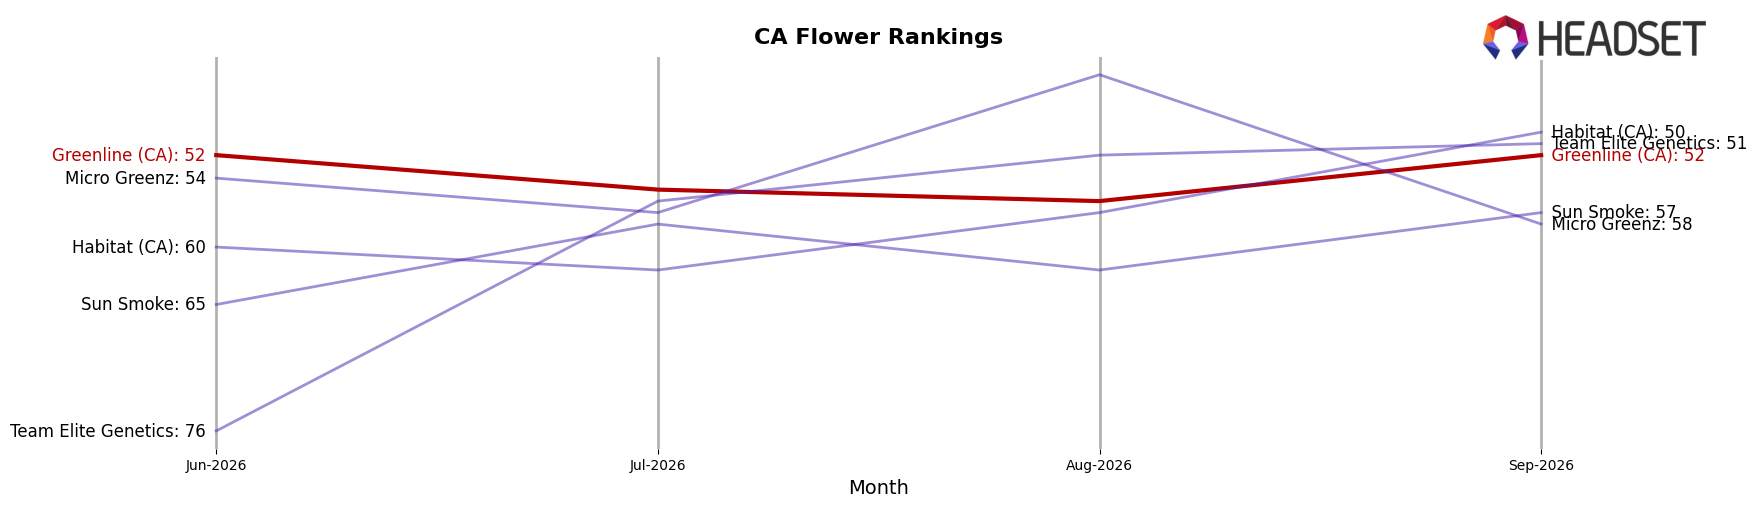
Greenline (CA) sits at rank #52 in California Flower in September 2026, improving 22 positions year over year from #74 and holding flat versus June 2026 at #52; its best rank of #51 in May 2026 suggests only a 1-position gap from its peak. Competitive pressure is intensifying at the top as STIIIZY rose from #2 to #1 while growing sales 47.8% year over year, and CAM climbed from #3 to #2 with 28.9% YoY growth, whereas CannaBiotix (CBX) slid from #1 to #3 with a 21.1% YoY sales decline; this mix of upward and downward shifts at the top, alongside a 22-rank YoY gain for Greenline (CA) but no quarter-over-quarter movement, implies momentum is returning but near-term share capture may stall without a catalyst to convert incremental rank gains into sustained advancement.
Notable Products
Kosher Kush Pre-Roll (1g) posted the standout move in September 2026 with a 72.4% month-over-month surge, climbing into rank 3 while Orange Tree Pre-Roll (1g) held rank 1 despite a 2.5% decline. Citrus Jack Pre-Roll (1g) advanced 15.1% at rank 2, but Blackberry Kush Sauce Cartridge (1g) slid 20.3% to rank 9, signaling volatility outside the top three. Four of the top ten are Pre-Roll SKUs, and Orange Tree (3.5g) in Flower ticked up 5.6% at rank 5 with $68,568 in September 2026 sales, implying Greenline (CA) is leaning into combustion formats while cartridges face near-term pressure.
Top Selling Cannabis Brands






Data for this report comes from real-time sales reporting by participating cannabis retailers via their point-of-sale systems, which are linked up with Headset’s business intelligence software. Headset’s data is very reliable, as it comes digitally direct from our partner retailers. However, the potential does exist for misreporting in the instance of duplicates, incorrectly classified products, inaccurate entry of products into point-of-sale systems, or even simple human error at the point of purchase. Thus, there is a slight margin of error to consider. Brands listed on this page are ranked in the top twenty within the market and product category by total retail sales volume.

