Jun-2026
Sales
Trend
6-Month
Product Count
SKUs
Avg Price
YoY Sales Change
YoY Price Change
Market Insights Snapshot
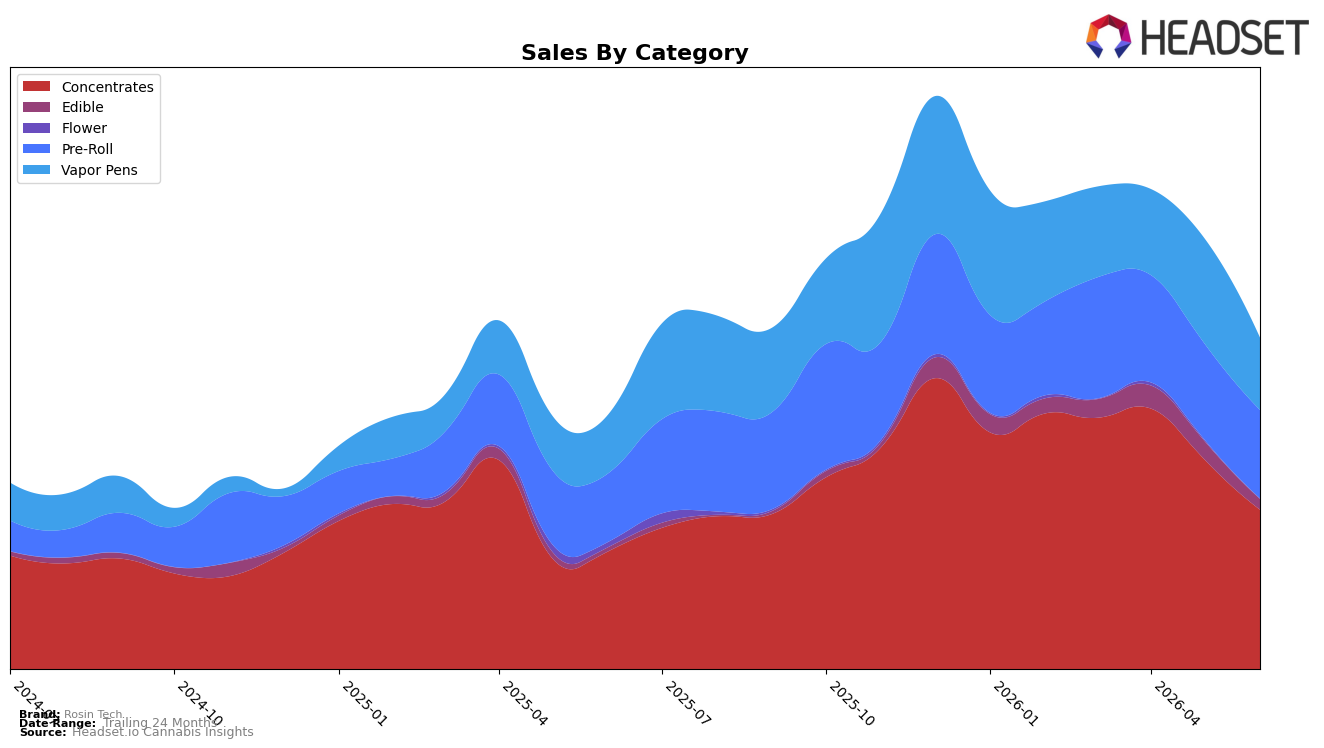
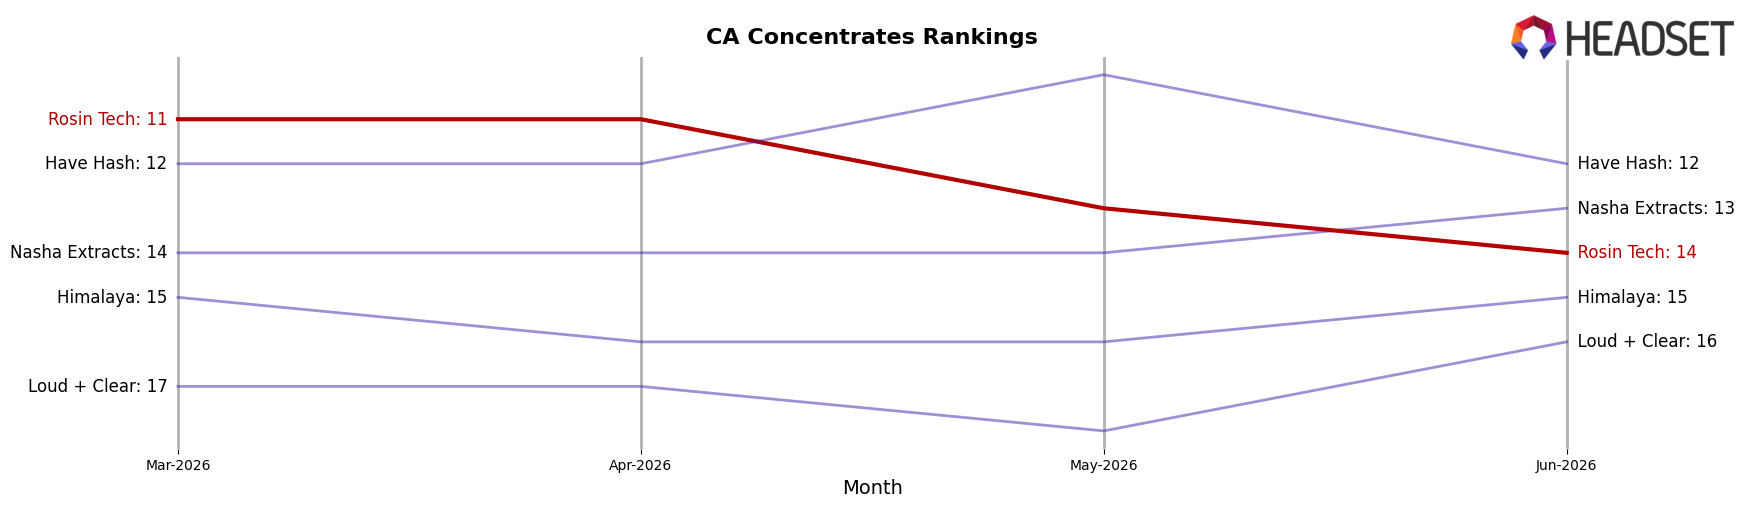
Rosin Tech’s mix in June 2026 concentrated into three pillars: Concentrates at 48.17% share with 35.49% YoY growth but a 23.96% MoM drop, Pre-Roll at 26.71% share with 29.03% YoY growth and an 8.02% MoM decline, and Vapor Pens at 21.85% share with 23.07% YoY growth but a 31.27% MoM contraction. Edible, while only 3.18% share, posted 165.54% YoY growth against a 42.30% MoM pullback, and Flower fell to 0.08% share with a 94.75% YoY decline and a 75.24% MoM slide. With average price up 2.34% YoY to $24.46 and Concentrates leading category share alongside a rank of 14 in Concentrates in California, the pattern implies a volume-led year-over-year expansion concentrated in higher-ticket formats, temporarily pressured by month-over-month volatility across all categories.
The shift toward Concentrates at 48.17% share and Vapor Pens at 21.85%—both carrying higher average prices of $33.30 and $41.28 respectively—positions Rosin Tech upmarket on potency and format sophistication, while Pre-Roll at 26.71% sustains breadth despite an 8.02% MoM dip and 29.03% YoY growth. The divergence where Edible surges 165.54% YoY yet contracts 42.30% MoM, alongside Flower’s 94.75% YoY decline and 0.08% share, implies a deliberate deprioritization of commodity Flower in favor of extraction-driven and ready-to-consume formats; this mix supports pricing power and differentiation, but the double-digit MoM declines of 23.96% in Concentrates and 31.27% in Vapor Pens indicate sensitivity to short-cycle demand swings that the brand will need to buffer with inventory pacing and promotional cadence.
Competitive Landscape
Rosin Tech sits at rank #14 in CA Concentrates in June 2026, improving 6 positions from #20 year over year, but slipping 3 spots from #11 in March 2026 after peaking at #10 in February 2026; by contrast, Raw Garden held #1 both year over year and in June 2026 while growing sales 7.0%, and 710 Labs climbed from #4 to #3 with a 24.7% YoY sales increase as Punch Extracts / Punch Edibles slid from #3 to #4 with a 29.1% YoY sales decline; this pattern implies Rosin Tech’s upward YoY trajectory is real but mid-year rank softness signals competitive pressure that requires reclaiming a top-10 position to convert momentum into durable share.
Notable Products
Critical Kush Hash Infused Pre-Roll (1g) posted the steepest decline at -54.8% while sliding to rank 7, as Mendo Breath Hash Infused Pre-Roll (1g) surged +61.5% to rank 1 and set the tone for June 2026. Do-Si-Dos Hash Infused Pre-Roll (1g) fell -33.5% at rank 5, and Blue Amaretto Hash Infused Pre-Roll (1g) dropped -38.7% at rank 8, while four of the top ten are Pre-Roll SKUs concentrated in hash-infused formats, indicating a bifurcation between a single breakout and several retrenching items. Within concentrates, Green Label - Mendo Rush Cold Cure Rosin (1g) gained +43.8% at rank 3 as Green Label - Strawberry Bomb Cold Cure Rosin (1g) edged +6.5% at rank 9, with Green Label - Peach Shine Cold Cure Rosin (1g) anchoring rank 2 on $24,084 in sales. The pattern points to a portfolio leaning on a few momentum leaders in Pre-Rolls and a steadier, tiered presence in concentrates, implying June 2026 favors selective push behind standout SKUs rather than broad-line expansion.
Top Selling Cannabis Brands
Data for this report comes from real-time sales reporting by participating cannabis retailers via their point-of-sale systems, which are linked up with Headset’s business intelligence software. Headset’s data is very reliable, as it comes digitally direct from our partner retailers. However, the potential does exist for misreporting in the instance of duplicates, incorrectly classified products, inaccurate entry of products into point-of-sale systems, or even simple human error at the point of purchase. Thus, there is a slight margin of error to consider. Brands listed on this page are ranked in the top twenty within the market and product category by total retail sales volume.

