.svg)

Sep-2026
Sales
Trend
6-Month
Product Count
SKUs
Avg Price
YoY Sales Change
YoY Price Change


Market Insights Snapshot
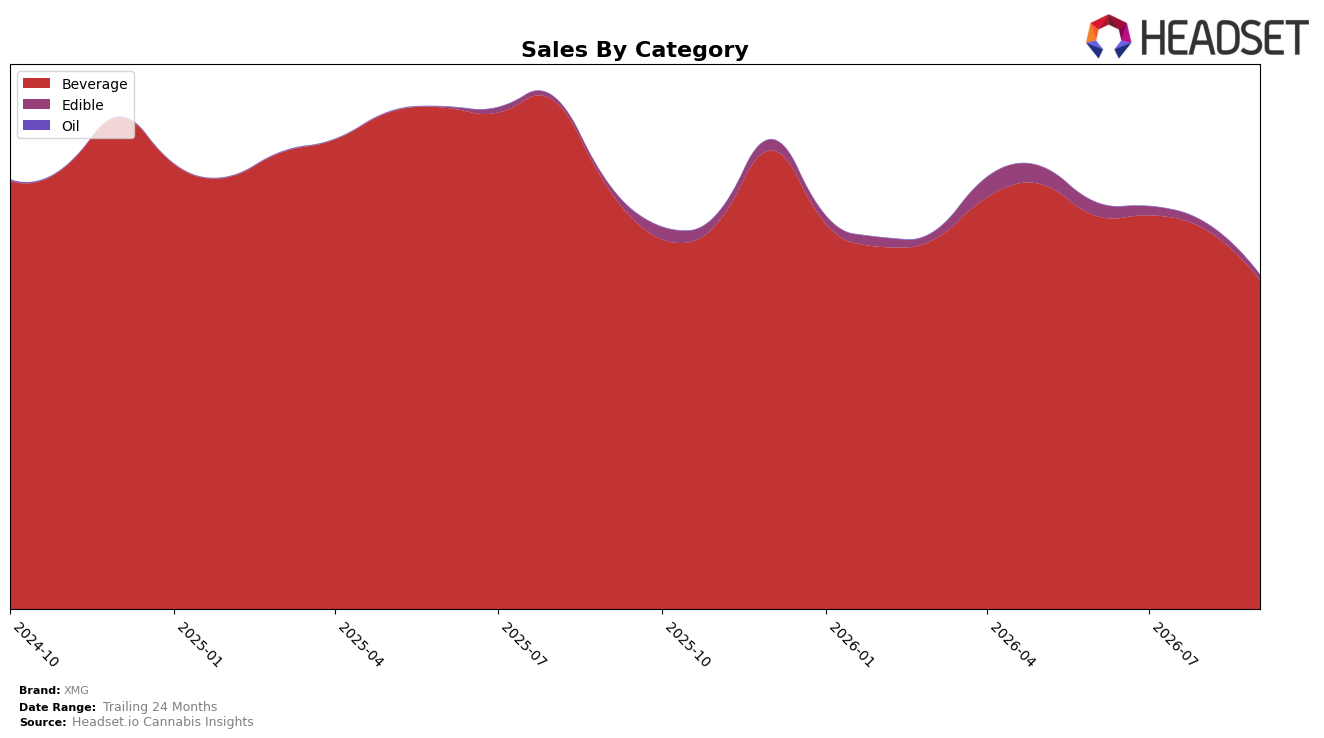
XMG concentrated 98.37% of September 2026 sales in Beverage, with Edible holding 1.63%, and the brand’s overall sales fell 21.50% year over year while average price rose 13.40%. Within Beverage, sales declined 21.90% year over year and 13.46% month over month, whereas Edible grew 15.23% year over year but dropped 18.86% month over month; this mix, combined with a 98.37% reliance on Beverage and a rank of 1 in Beverage in Alberta, implies the brand is overexposed to a shrinking primary category and is using price to protect value rather than volume.
The tilt toward Beverage at 98.37% share alongside a 21.90% year-over-year decline in that category and a 13.46% month-over-month pullback suggests the brand’s leadership position (rank 1 in Beverage in Alberta) rides on a contracting base, while Edible’s 15.23% year-over-year growth from a 1.63% share lacks scale to offset volatility. With average price up 13.40% against a 21.50% year-over-year sales decline, the pattern implies XMG is prioritizing unit economics over penetration, which could sustain category rank in Alberta but risks further share erosion if Beverage’s month-over-month softness persists into October 2026.
Competitive Landscape
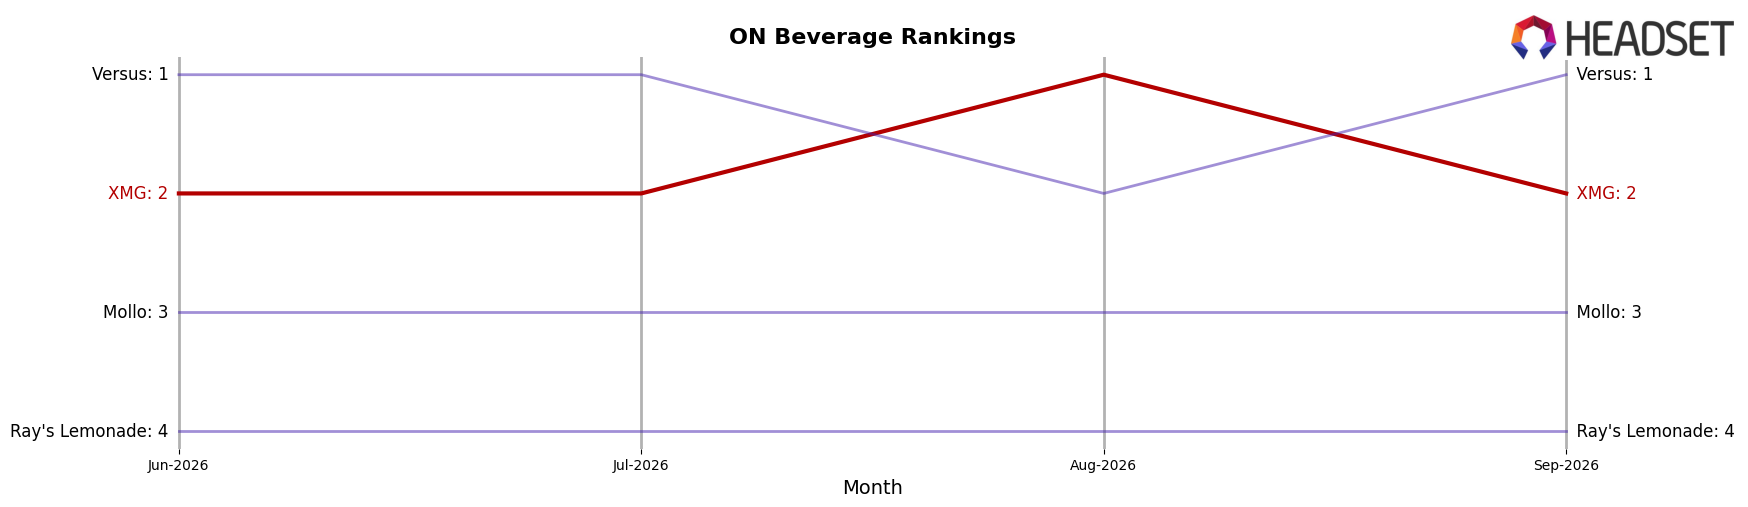
XMG sits at #2 in ON Beverage in September 2026 after a YoY slide from #1, holding #2 for the past three months while peaking at #1 in August 2026; in contrast, Versus is #1 now versus #2 a year ago with +9.7% YoY sales, and Mollo remains #3 YoY with -6.1% sales, indicating that XMG’s dip from #1 to #2 alongside a competitor’s upward move and another’s contraction implies a maturing leadership contest where XMG’s rank stability points to share defense rather than expansion.
Notable Products
XMG’s Zero - Orange Soda (10mg THC, 355ml) led the pullback with a -18.2% month-over-month change while holding rank 1, and Cherry Cola (10mg THC, 355ml) slid -11.1% at rank 2; meanwhile, Atomic Sours - CBG/THC 1:1 Cherry Blasted Lime Carbonated Guarana (10mg CBG, 10mg THC, 355ml) declined -20.5% but sat lower at rank 6. Four of the top ten are Plus co-branded 1:1 SKUs and three are Atomic Sours variants, yet each registered double-digit drops between -13.8% and -14.3% for mid-pack ranks 4, 5, and 9, indicating category-wide softness rather than a single-SKU issue. With the top three all beverages and zero non-beverages in the top ten, concentration risk in one category is amplifying volatility, implying XMG’s commercial direction is exposed to seasonal demand swings and would benefit from mix diversification.
Top Selling Cannabis Brands






Data for this report comes from real-time sales reporting by participating cannabis retailers via their point-of-sale systems, which are linked up with Headset’s business intelligence software. Headset’s data is very reliable, as it comes digitally direct from our partner retailers. However, the potential does exist for misreporting in the instance of duplicates, incorrectly classified products, inaccurate entry of products into point-of-sale systems, or even simple human error at the point of purchase. Thus, there is a slight margin of error to consider. Brands listed on this page are ranked in the top twenty within the market and product category by total retail sales volume.

