Jun-2026
Sales
Trend
6-Month
Product Count
SKUs
Avg Price
YoY Sales Change
YoY Price Change
Market Insights Snapshot
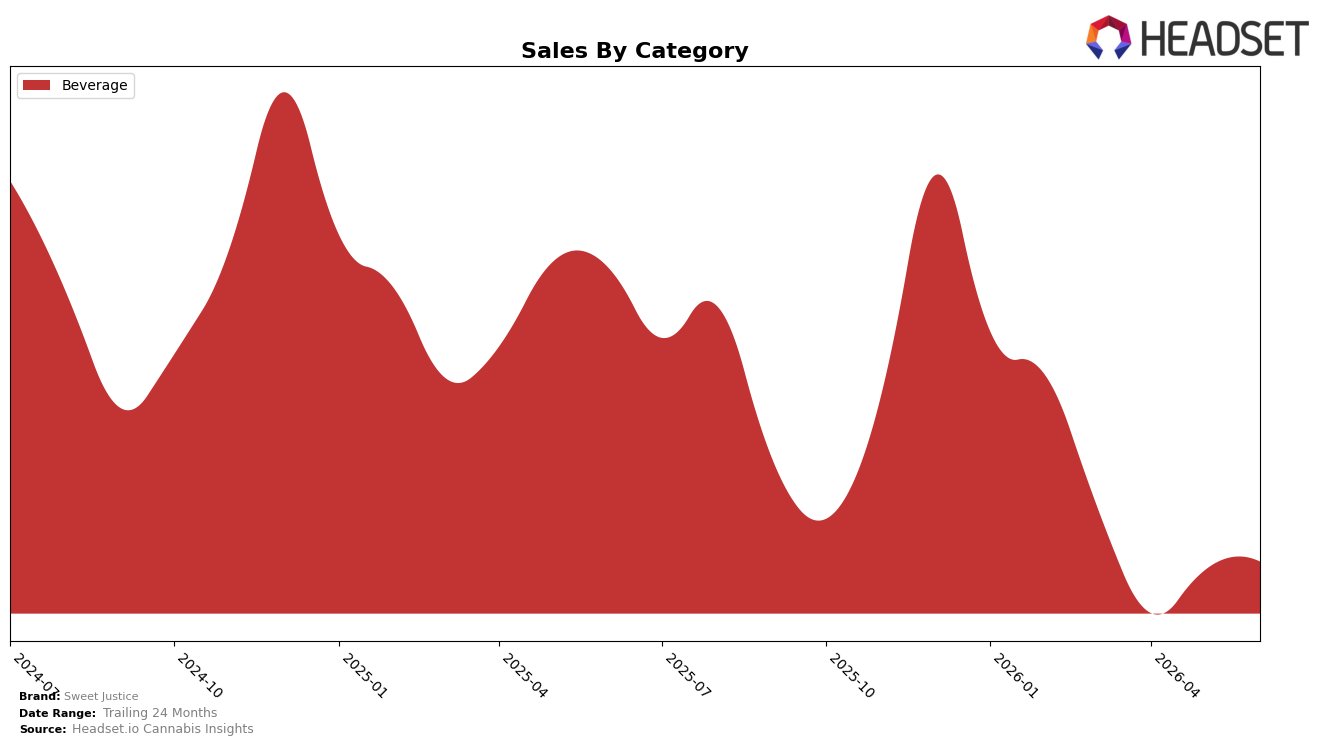
In June 2026, Sweet Justice concentrated entirely in Beverage with a 100.0% category share, pairing a 1.19% month-over-month sales uptick with a -28.29% year-over-year decline; average price dipped -0.63% YoY while remaining stable MoM, indicating volume rather than pricing drove the slight monthly gain. With Beverage as both the top category and sole contributor, and Ontario as the leading province, the mix is simplified and exposes the brand to category swings; the pattern implies that the June 2026 MoM improvement is a short-term lift within a longer YoY contraction, not a broad-based recovery across categories.
Holding rank 4 in Beverage in British Columbia while posting a -28.29% YoY sales change and a 1.19% MoM increase suggests Sweet Justice is defending placement through share within a narrowed focus rather than expanding breadth; the -0.63% YoY average price move points to minimal price-led repositioning. Concentration at 100.0% Beverage and a 24‑month sales change of -21.09% imply the brand’s positioning leans on depth in a single category, so sustaining rank depends on converting the modest June 2026 MoM momentum into sustained share gains rather than diversifying mix.
Competitive Landscape
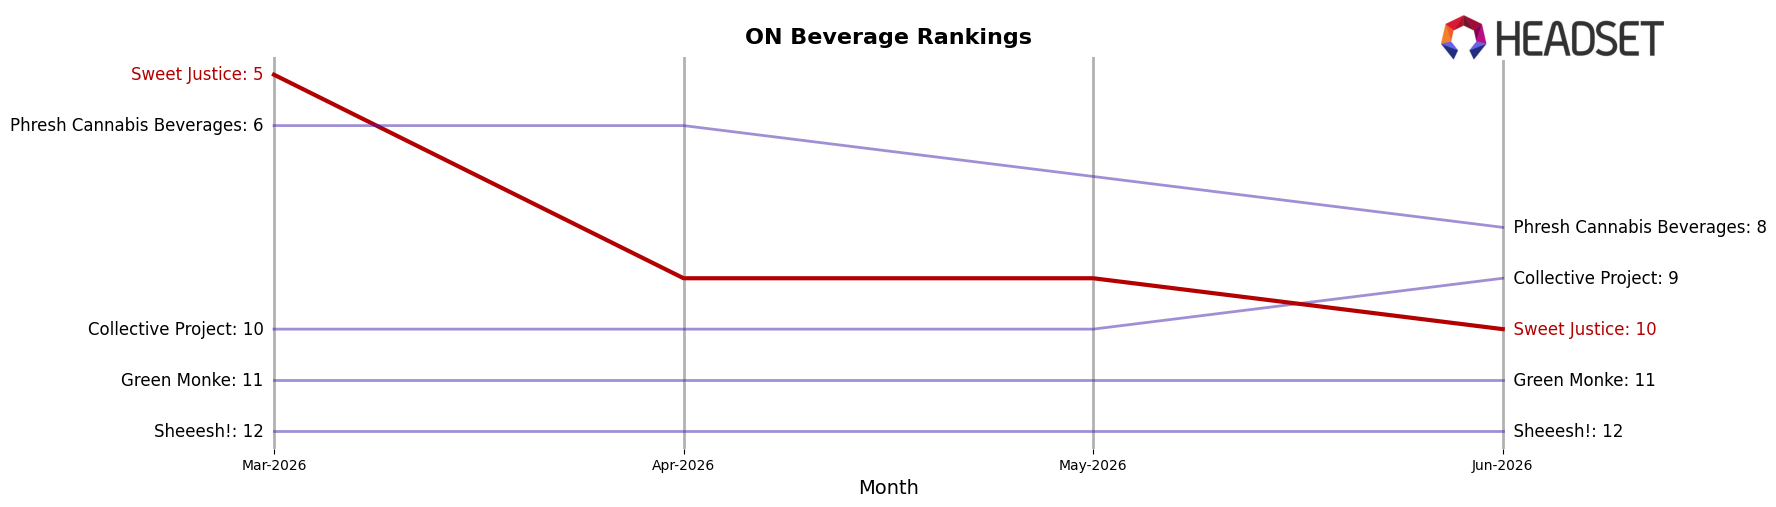
Sweet Justice sits at #10 in ON Beverage in June 2026, down 4 ranks year over year from #6, and off 5 positions from March 2026’s #5, despite having peaked at #4 in February 2026; meanwhile, TeaPot climbed from #10 to #5 with 129.5% YoY sales growth while Sweet Justice ceded 4 ranks, and XMG held #1 even as its sales fell 37.0% YoY, contrasting with Sweet Justice’s sharper rank erosion from #6 to #10; with Ray's Lemonade moving up from #5 to #4 on 23.5% YoY growth and Sweet Justice sliding 1 spot quarter-over-quarter from #9 to #10, the pattern implies Sweet Justice is losing relative velocity to faster risers and needs a catalyst to re-enter the top 5 it last touched in February 2026.
Notable Products
CBG/THC 1:1 Lemonade Ginger Ale Soda (10mg CBG, 10mg THC, 355ml, 12oz) posted the largest move in June 2026 with +55.4% MoM while holding rank 6, outpacing the rank 1 THC/CBG 1:1 OG Root Beer Free Soda (10mg THC, 10mg CBG, 355ml) at +26.6% and contrasting the rank 7 CBD/THC 1:1 Elderflower Pomegranate Fruit Drink (5mg CBD, 5mg THC, 355ml) at -19.4%. With ranks 1 through 10 all in Beverage, and three CBG-forward 1:1 SKUs sitting within the top 6, the mix tilts toward functional CBG formats rather than CBD-leaning fruit drinks that fell between -19.4% and -23.1%. The rank 2 OG Cola Soda (10mg THC, 12oz, 355ml) was comparatively flat at +3.5% while Cherry Cola (10mg THC, 12oz, 355ml) slipped -0.4% at rank 3, indicating classic THC-only colas are steady but not the growth engine. The pattern implies Sweet Justice is shifting demand toward CBG-inclusive formulations, suggesting portfolio emphasis on 1:1 CBG lines and sugar-free variants to capture momentum away from declining CBD-fruit drinks, even as a single leader still contributes $116,078.
Top Selling Cannabis Brands
Data for this report comes from real-time sales reporting by participating cannabis retailers via their point-of-sale systems, which are linked up with Headset’s business intelligence software. Headset’s data is very reliable, as it comes digitally direct from our partner retailers. However, the potential does exist for misreporting in the instance of duplicates, incorrectly classified products, inaccurate entry of products into point-of-sale systems, or even simple human error at the point of purchase. Thus, there is a slight margin of error to consider. Brands listed on this page are ranked in the top twenty within the market and product category by total retail sales volume.

