Mar-2026
Sales
Trend
6-Month
Product Count
SKUs
Avg Price
YoY Sales Change
YoY Price Change
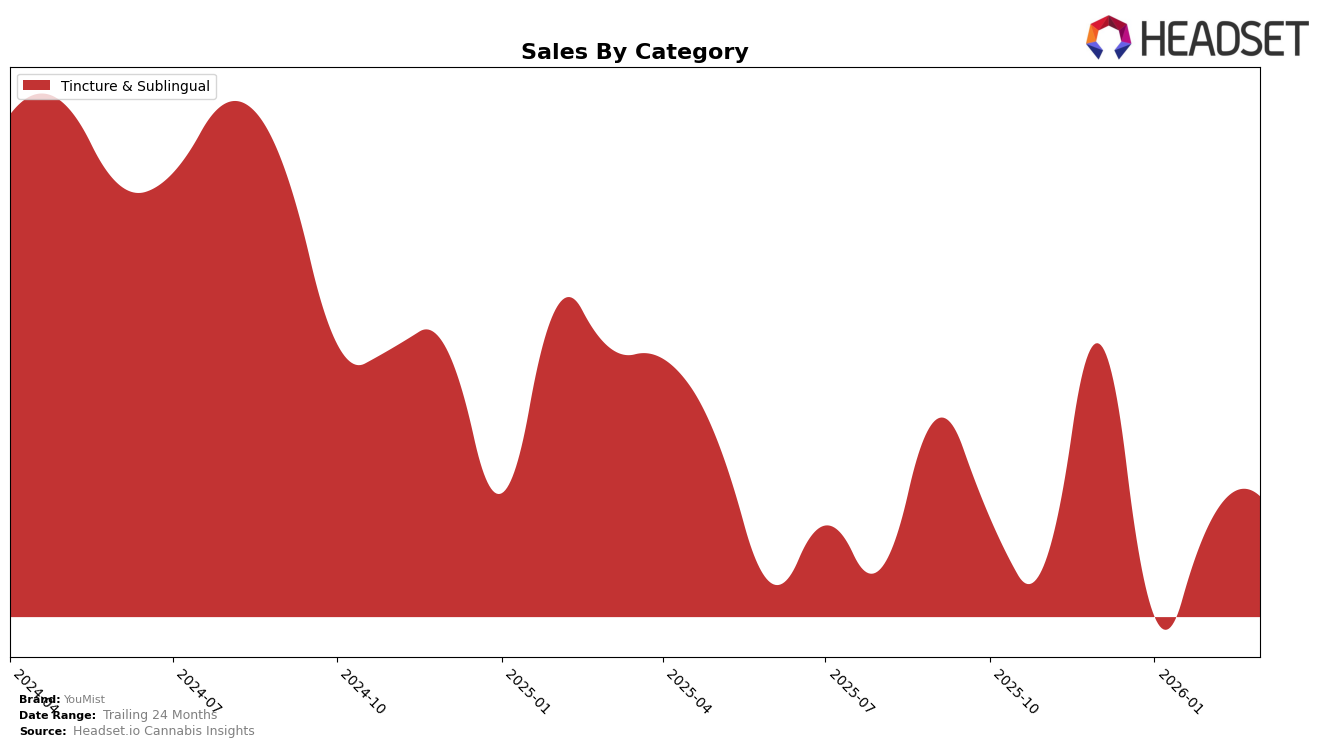
Market Insights Snapshot
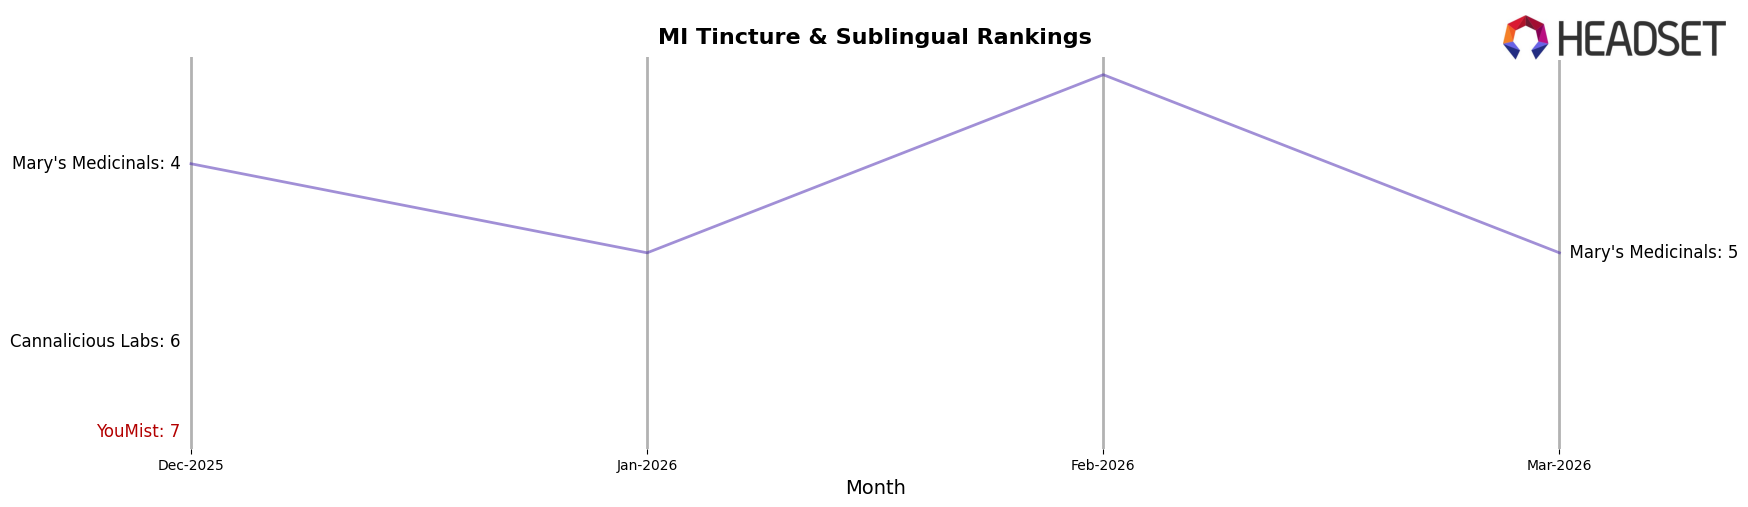
In the state of Michigan, YouMist has shown a notable presence in the Tincture & Sublingual category. As of December 2025, the brand was ranked 7th, indicating a strong foothold in this segment. However, it is important to note that in the subsequent months of January, February, and March 2026, YouMist did not appear in the top 30 rankings. This absence could suggest a decline in their competitive standing or a possible shift in consumer preferences within the state. Despite this, the brand's sales in December 2025 were noteworthy, reflecting initial strong consumer interest and market penetration.
Across other states and categories, YouMist's performance can be characterized by its varying presence and ranking fluctuations. The absence of YouMist in the rankings for the months following December 2025 in Michigan may highlight challenges or strategic shifts that the brand is navigating in the competitive landscape. Such movements are critical for industry stakeholders to monitor, as they may signal broader trends impacting market dynamics. Observing these patterns provides valuable insights into the brand's market strategies and consumer engagement, offering a glimpse into the challenges and opportunities that lie ahead for YouMist.
Competitive Landscape
In the competitive landscape of the Tincture & Sublingual category in Michigan, YouMist experienced a notable absence from the top 20 rankings from January to March 2026, after holding the 7th position in December 2025. This decline in rank suggests a potential decrease in market visibility and consumer preference. In contrast, Mary's Medicinals maintained a strong presence, fluctuating between the 3rd and 5th positions during the same period, indicating consistent consumer demand and effective market strategies. Meanwhile, Cannalicious Labs was ranked 6th in December 2025 but did not appear in the top 20 in subsequent months, similar to YouMist. The competitive dynamics highlight the importance for YouMist to reassess its marketing and distribution strategies to regain its standing and drive sales growth in this category.
Notable Products
In March 2026, Sleepy Mist - CBD/THC 1:1 Mint Breath Spray maintained its position as the top-performing product for YouMist, showing consistent popularity with a notable sales figure of 198 units. Energy - THC/CBG 1:1 Cinnamon Mist Spray climbed to the second position, indicating a resurgence in demand after not being ranked in January and February. Monster X Energy Mist and Watermelon Mist Breathspray both shared the third rank, with Watermelon Mist slipping from its previous second position in January. Mellow Mist- CBD/THC 1:1 Citrus Breathspray improved its rank to fourth place, showing a steady increase from its debut rank of fifth in January. Overall, the rankings highlight a dynamic shift in consumer preferences, with Energy - THC/CBG 1:1 Cinnamon Mist Spray making a significant comeback.
Top Selling Cannabis Brands
Data for this report comes from real-time sales reporting by participating cannabis retailers via their point-of-sale systems, which are linked up with Headset’s business intelligence software. Headset’s data is very reliable, as it comes digitally direct from our partner retailers. However, the potential does exist for misreporting in the instance of duplicates, incorrectly classified products, inaccurate entry of products into point-of-sale systems, or even simple human error at the point of purchase. Thus, there is a slight margin of error to consider. Brands listed on this page are ranked in the top twenty within the market and product category by total retail sales volume.

