


Where to Buy
Yummy Gummy is stocked at 28 licensed dispensaries across Arizona and Oregon, 15 of them in Arizona, with the deepest coverage in Phoenix, Flagstaff, Mesa, Apache Junction, and Cave Creek. Search by ZIP code or city below to find the closest one.
Market Insights Snapshot
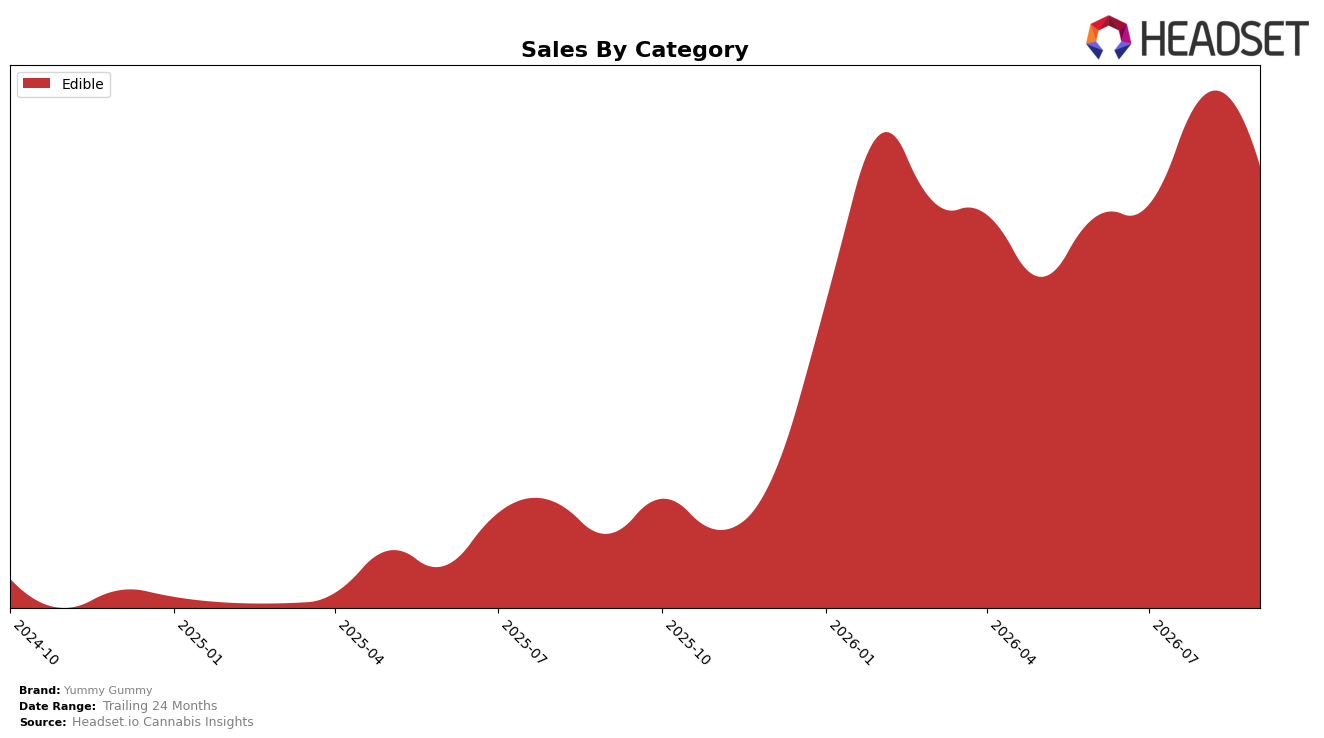
Yummy Gummy operated as a single-category brand in September 2026, with Edible at 100.0% category share and a -13.14% month-over-month shift paired with a 358.07% year-over-year increase; the brand’s overall 24-month sales expansion of 4,427.95% contrasts with a -41.41% year-over-year change in average price, indicating volume-led gain. Within Oregon Edibles, the brand sat at rank 28 while holding 100.0% of its mix in Edibles, implying a focused, price-elastic volume strategy rather than a diversified portfolio.
The compression in average price by -41.41% year-over-year alongside a -13.14% month-over-month sales pullback and a 358.07% year-over-year surge indicates a positioning anchored on accessible price points that trade for velocity rather than premium margin. With rank 28 in Oregon Edibles and a 100.0% category concentration, the pattern implies headroom to climb the rankings via mix expansion or premium tiers if price recovers, but near-term competitiveness will rely on maintaining volume intensity despite the average price at $3.73.
Competitive Landscape
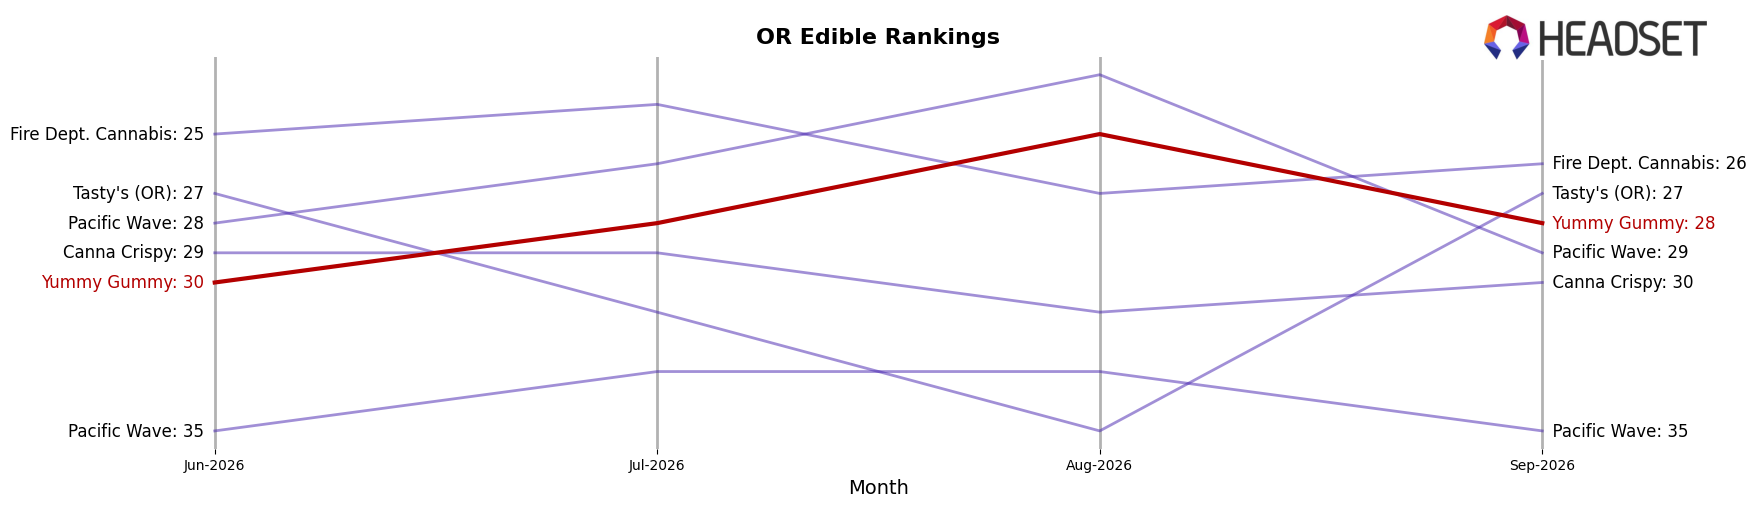
Yummy Gummy sits at rank #28 in OR Edible in September 2026 with no year-over-year rank reported, slipping 2 positions from #30 in June 2026 while peaking at #25 in August 2026. Against this backdrop, Wyld held #1 with a 4.3% YoY sales increase while Gron / Grön stayed at #2 with a 5.0% YoY sales decline, indicating the top tier is stable even as trajectories diverge. The combination of a 3-position dip from the August 2026 peak to #28 and a 2-position improvement since June 2026 implies Yummy Gummy is oscillating around the mid-to-late 20s, suggesting near-term share is more likely won via consistency than step-change gains.
Notable Products
THC/CBN 2:1 Blackout Cherry Gummies 10-Pack (100mg THC, 50mg CBN) posted the standout move in September 2026 with a +66.9% month-over-month surge into rank 7, while Cotton Candy Gummies (100mg) fell -20.9% to rank 2. Watermelon Gummies (100mg) rose +46.3% to rank 1 as Green Apple Gummies (100mg) dropped -29.1% to rank 3. The coexistence of a +66.9% functional SKU gain alongside double-digit declines of -20.9% and -29.1% among core flavors implies consumer shift toward differentiated formulations even as classic flavors churn at the top ranks.
Top Selling Cannabis Brands




Data for this report comes from real-time sales reporting by participating cannabis retailers via their point-of-sale systems, which are linked up with Headset’s business intelligence software. Headset’s data is very reliable, as it comes digitally direct from our partner retailers. However, the potential does exist for misreporting in the instance of duplicates, incorrectly classified products, inaccurate entry of products into point-of-sale systems, or even simple human error at the point of purchase. Thus, there is a slight margin of error to consider. Brands listed on this page are ranked in the top twenty within the market and product category by total retail sales volume.

