.svg)

Sep-2026
Sales
Trend
6-Month
Product Count
SKUs
Avg Price
YoY Sales Change
YoY Price Change


Market Insights Snapshot
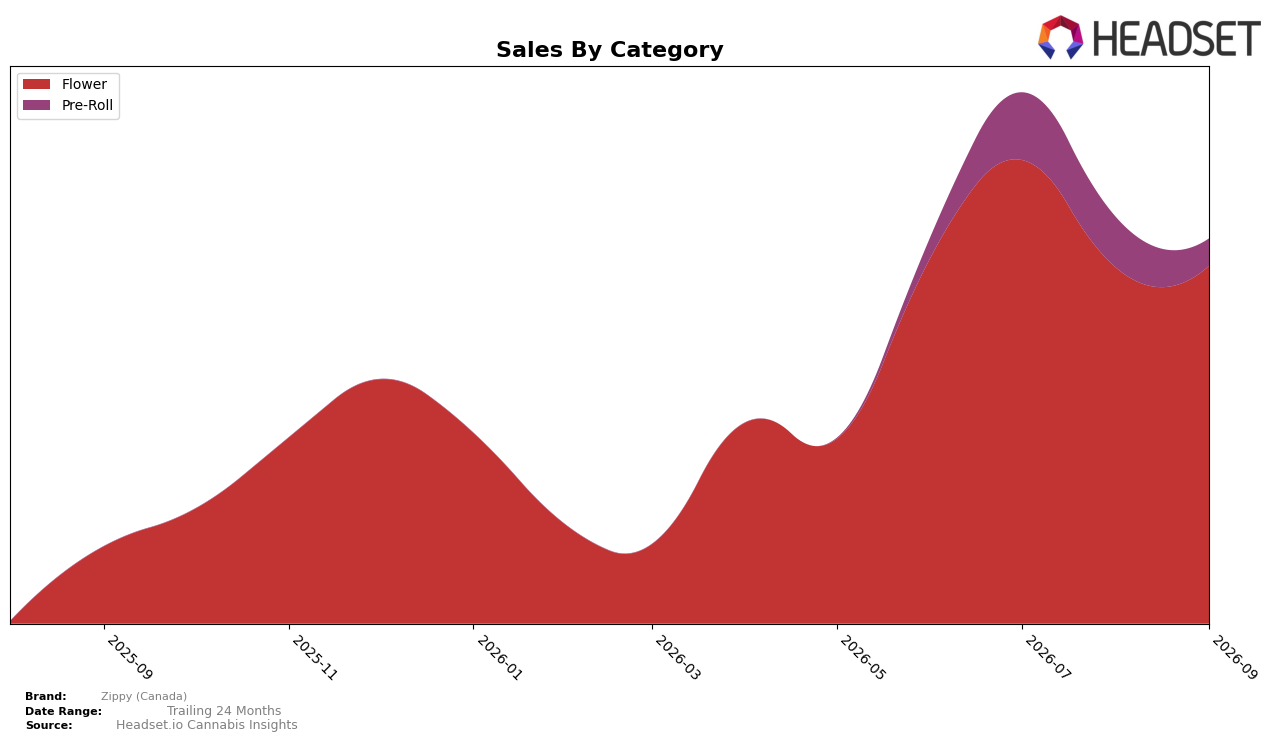
In September 2026, Zippy (Canada) concentrated 92.97% of sales in Flower, with Pre-Roll at 7.03%, and Flower advanced 364.66% year over year while inching up 0.45% month over month; by contrast, Pre-Roll’s month-over-month change was -46.28% with no year-over-year baseline. The average price fell 61.43% year over year to $39.19 even as total brand sales rose 399.78%, and within that, Flower’s average price sat at 47.94 while Pre-Roll averaged 11.48, implying mix-driven volume expansion under lower price points. The pattern suggests Zippy (Canada) is monetizing a Flower-led push with elastic demand that offsets price compression, while a steep month-over-month pullback in Pre-Roll signals a deliberate tilt away from small-format velocity in favor of higher-ticket Flower baskets.
With Flower holding a 92.97% share and ranking 5 in Flower within Saskatchewan, the 0.45% month-over-month increase alongside a 364.66% year-over-year gain positions the brand to compete on depth within a single category rather than breadth across segments. The 46.28% month-over-month contraction in Pre-Roll combined with a 61.43% year-over-year price decline indicates that Zippy (Canada) is leaning on price-to-volume conversion in Flower while trimming exposure to lower-price, convenience formats. This points to a positioning that prioritizes Flower share capture and sustained rank in core markets, using aggressive pricing to scale unit throughput while accepting volatility in secondary categories.
Competitive Landscape
Zippy (Canada) sits at #5 in SK Flower in September 2026, a 27-place climb from #32 year over year and a 2-spot rise from #7 in June 2026; however, its peak of #4 in July 2026 indicates a one-rank pullback since that month. Competitive pressure is clear: Back Forty / Back 40 Cannabis held at #1 year over year while growing sales by 22.8%, and Spinach moved from #5 to #2 alongside a 60.2% sales increase, outpacing Zippy (Canada)’s rank momentum between July 2026 (#4) and September 2026 (#5). The pattern implies Zippy (Canada)’s trajectory is upward but plateauing near the top tier, requiring incremental share wins to convert mid-year gains into a sustained top-3 position.

Notable Products
Funky Town Milled (3.5g) posted the standout move with a 103.6% month-over-month surge to rank 2, while Sour Tryptonite Milled (3.5g) slid 15.9% to rank 3. At the same time, Sour Tryptonite Pre-Roll 3-Pack (1.5g) held rank 1 with a 15.0% lift, contrasting with a 41.6% drop for Funkytown Pre-Roll 3-Pack (1.5g) at rank 5. With four of the top ten landing in Flower and one Pre-Roll rising as another fell, the mix points to a pivot toward milled and larger-format Flower as the primary volume engine for Zippy (Canada).
Top Selling Cannabis Brands






Data for this report comes from real-time sales reporting by participating cannabis retailers via their point-of-sale systems, which are linked up with Headset’s business intelligence software. Headset’s data is very reliable, as it comes digitally direct from our partner retailers. However, the potential does exist for misreporting in the instance of duplicates, incorrectly classified products, inaccurate entry of products into point-of-sale systems, or even simple human error at the point of purchase. Thus, there is a slight margin of error to consider. Brands listed on this page are ranked in the top twenty within the market and product category by total retail sales volume.

