.svg)

Sep-2026
Sales
Trend
6-Month
Product Count
SKUs
Avg Price
YoY Sales Change
YoY Price Change


Market Insights Snapshot
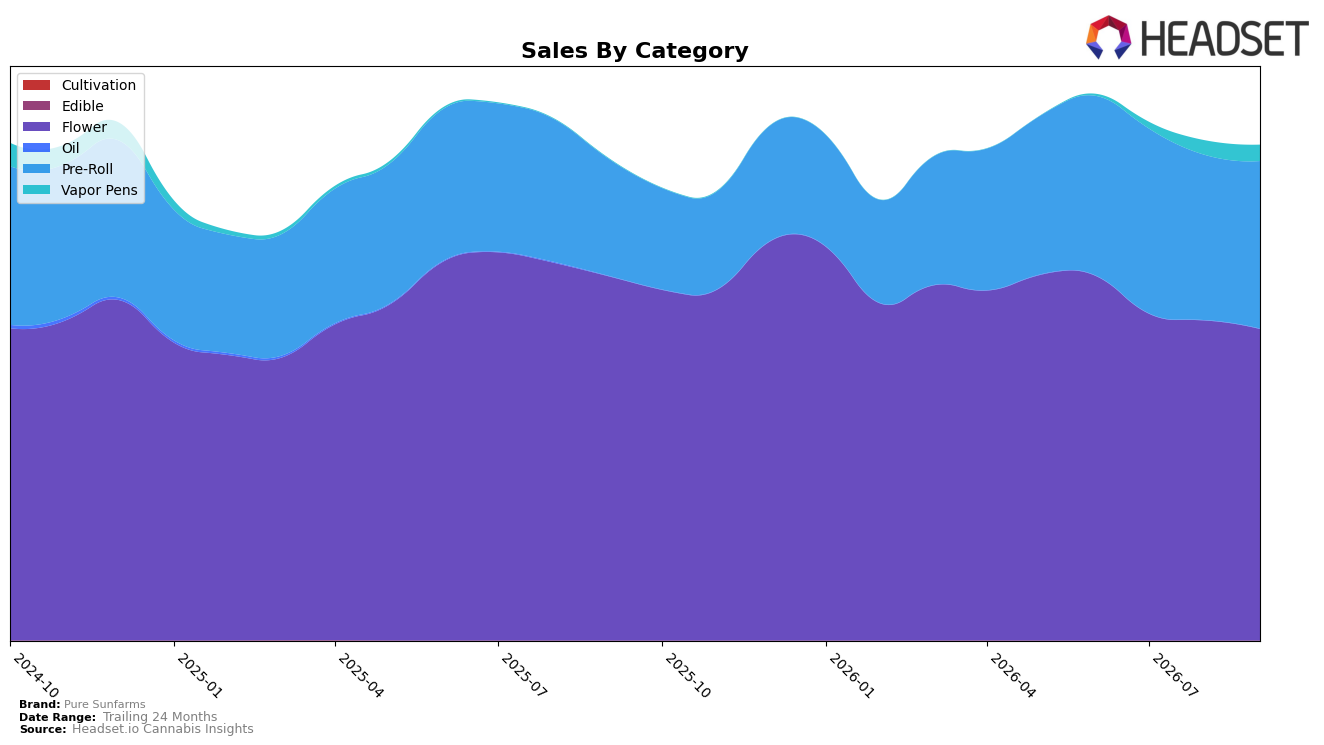
In September 2026, Pure Sunfarms concentrated 62.94% of sales in Flower with year-over-year down 14.51% and month-over-month down 2.67%, while Pre-Roll expanded to 33.81% share with year-over-year up 42.99% and month-over-month up 1.38%. Vapor Pens, though only 3.25% share, posted year-over-year up 3,815.42% and month-over-month up 12.57%, contrasting with Oil at 0.01% share and year-over-year down 64.95% with no month-over-month reading. With overall brand sales year-over-year up 2.71% alongside an average price year-over-year down 5.05%, the mix shift toward Pre-Roll and Vapor Pens is offsetting Flower contraction; the thesis is that Pure Sunfarms is reallocating volume into faster-turn formats to sustain growth as Flower cools.
Pure Sunfarms’ stance in Flower remains material at 62.94% share, supported by a category rank of 3 in Flower in Alberta, but the simultaneous 42.99% Pre-Roll growth and 12.57% month-over-month Vapor Pens lift suggests a portfolio hedging away from single-category dependency. With Ontario as the top market and Vapor Pens average price at 35.98 against brand average price at $33.15, the upward-momentum segments are positioned to raise mix quality even as Flower endures a 14.51% annual decline; the implication is that Pure Sunfarms is pivoting toward value-accessible inhalables where incremental share gains can be harvested without relying on Flower recovery.
Competitive Landscape
Pure Sunfarms sits at rank #6 in ON Flower in September 2026, down one spot year over year from #5, with no change versus June 2026 at #6, while the brand’s peak of #4 in April 2025 establishes a two-position slide from its historical high; by contrast, Spinach moved from #3 to #1 with approximately 15.7% year-over-year sales growth and FIGR jumped from #14 to #5 with roughly 51.7% growth as Back Forty / Back 40 Cannabis fell from #1 to #3 alongside a 7.4% decline, indicating the competitive set is redistributing share around the top five; taken together, a stable #6 in June 2026 and September 2026 alongside a YoY dip from #5 implies Pure Sunfarms is holding mid-pack but ceding momentum to faster risers, which pressures future shelf visibility unless the rank trajectory reverses.

Notable Products
Pink Kush (7g) posted the steepest decline in September 2026 at -11.8% while sliding to rank 4, as Pink Kush (3.5g) also fell -7.2% at rank 2, indicating pressure on Flower formats despite Pink Kush Pre-Roll 10-Pack (3g) holding rank 1 with a -1.8% dip. Pre-Rolls concentrated the leaderboard with six of the top ten SKUs, including Pink Kush Pre-Roll 10-Pack (3.5g) up +4.7% at rank 3 and Blue Dream#16 Pre-Roll 10-Pack (3.5g) up +18.0% at rank 6, contrasting with Pink Kush Pre-Roll 3-Pack (1.5g) down -11.2% at rank 8. The mix points to a pivot toward multi-pack Pre-Rolls driving share while legacy Flower sizes face elasticity limits and format substitution.
Top Selling Cannabis Brands






Data for this report comes from real-time sales reporting by participating cannabis retailers via their point-of-sale systems, which are linked up with Headset’s business intelligence software. Headset’s data is very reliable, as it comes digitally direct from our partner retailers. However, the potential does exist for misreporting in the instance of duplicates, incorrectly classified products, inaccurate entry of products into point-of-sale systems, or even simple human error at the point of purchase. Thus, there is a slight margin of error to consider. Brands listed on this page are ranked in the top twenty within the market and product category by total retail sales volume.

