.svg)

Sep-2026
Sales
Trend
6-Month
Product Count
SKUs
Avg Price
YoY Sales Change
YoY Price Change


Where to Buy
Aeterna is stocked at 46 licensed dispensaries across New York, with the deepest coverage in New York, Brooklyn, Queens, Buffalo, and Hudson. Search by ZIP code or city below to find the closest one, or filter by product type if you are after a specific format.
Market Insights Snapshot
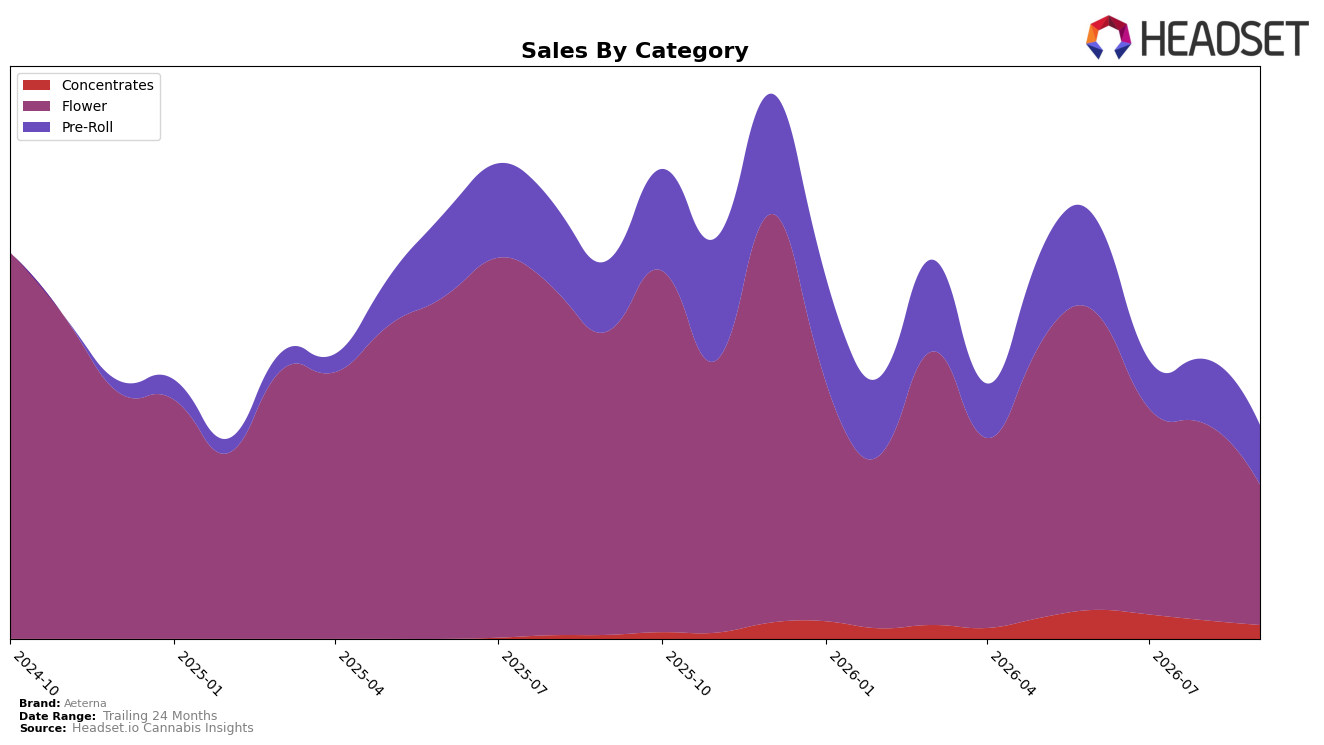
In September 2026, Aeterna’s category mix tilted heavily to Flower at 65.70% share, but Flower declined both year over year by 53.87% and month over month by 28.67%, while Pre-Roll held 27.80% share with a smaller 16.16% YoY drop and a 7.69% MoM dip. Concentrates expanded to 6.50% share with a 244.61% YoY increase despite a 25.44% MoM pullback, contributing a countercurrent to the brand’s overall 43.65% YoY sales contraction and a 21.36% YoY decline in average price; taken together, this mix signals dependence on a shrinking Flower base while a small but faster-growing Concentrates pocket emerges.
These shifts imply that Aeterna’s positioning is anchored to a weakening core where Flower’s steep 53.87% YoY decline and rank at 82 in New York limit visibility, even as Pre-Roll’s milder 16.16% YoY decline and Concentrates’ 244.61% YoY surge provide diversification runway. The simultaneous 28.67% MoM Flower drop and 25.44% MoM Concentrates pullback suggest near-term volatility, but the relative resilience of Pre-Roll’s 7.69% MoM decline indicates a stabilizer segment; strategically, shifting promotional and assortment emphasis toward Pre-Roll and scaling proven Concentrates SKUs could rebalance share away from the 65.70% Flower concentration without further compressing the 25.53 average price.
Competitive Landscape
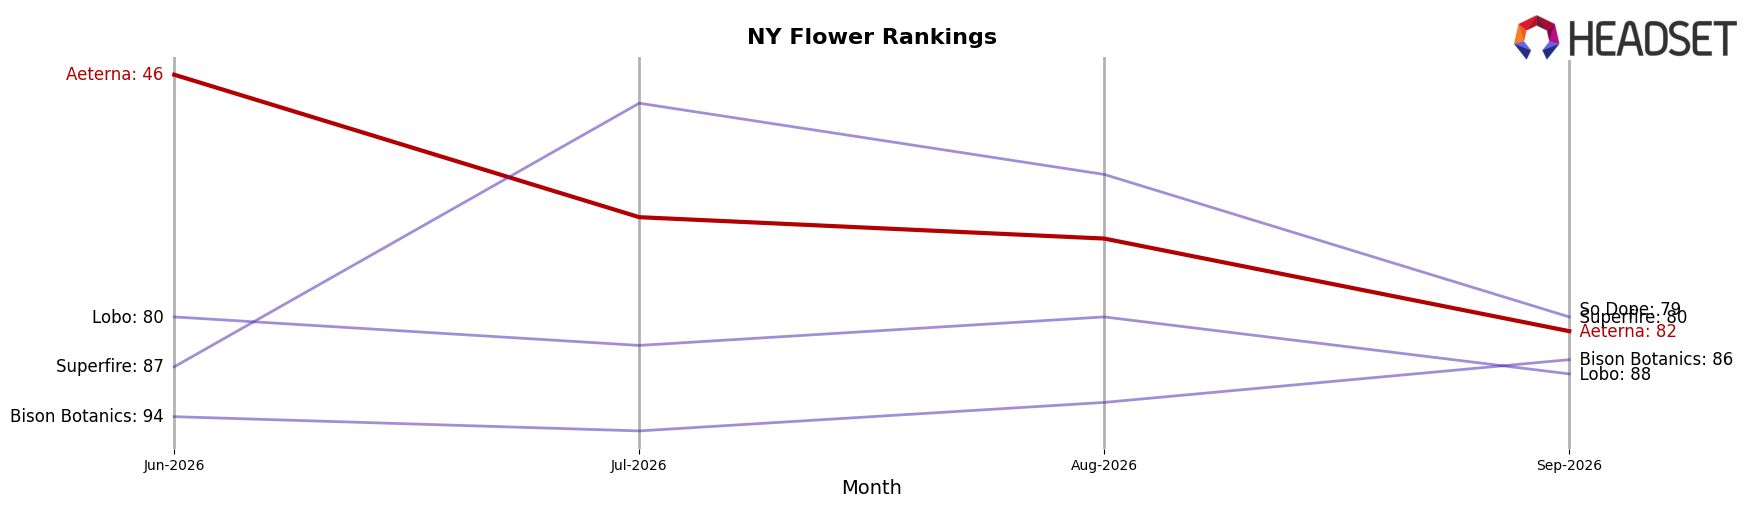
Aeterna sits at rank #82 in New York Flower in September 2026 after a year-over-year slide of 44 positions from #38, and it also dropped 36 spots from #46 in June 2026, marking a steep descent from its peak of #25 in September 2024; meanwhile, Find. climbed to #1 with a 5-position YoY gain and Grassroots advanced to #2 with a 15-position YoY jump alongside 150.33% sales growth, indicating Aeterna’s relative rank erosion is accelerating as top rivals move up the ladder, which implies current positioning reflects share loss pressure rather than temporary noise.
Notable Products
DayTime Blend Pre-Roll (1g) posted the standout move in September 2026 with +156.7% MoM and a jump to rank 3, while Lemon Haze (3.5g) fell -38.8% MoM to rank 7. Anytime Blend Pre-Roll (1g) rose +32.3% MoM to hold rank 1, and Garlic Runtz (3.5g) declined -16.4% MoM to rank 4. With four of the top ten in Pre-Roll, the surge in DayTime and stability in Anytime indicate the mix is tilting toward ready-to-use formats and away from down-trending Flower SKUs, pointing to portfolio emphasis on Pre-Roll velocity over bulk Flower volume.
Top Selling Cannabis Brands






Data for this report comes from real-time sales reporting by participating cannabis retailers via their point-of-sale systems, which are linked up with Headset’s business intelligence software. Headset’s data is very reliable, as it comes digitally direct from our partner retailers. However, the potential does exist for misreporting in the instance of duplicates, incorrectly classified products, inaccurate entry of products into point-of-sale systems, or even simple human error at the point of purchase. Thus, there is a slight margin of error to consider. Brands listed on this page are ranked in the top twenty within the market and product category by total retail sales volume.

