.svg)

Sep-2026
Sales
Trend
6-Month
Product Count
SKUs
Avg Price
YoY Sales Change
YoY Price Change


Where to Buy
The Botanist is stocked at 489 licensed dispensaries across New York, Illinois, and 4 other states, 158 of them in New York, with the deepest coverage in New York, Queens, Brooklyn, Rochester, and Staten Island. Search by ZIP code or city below to find the closest one, or filter by product type if you are after a specific format.
Market Insights Snapshot
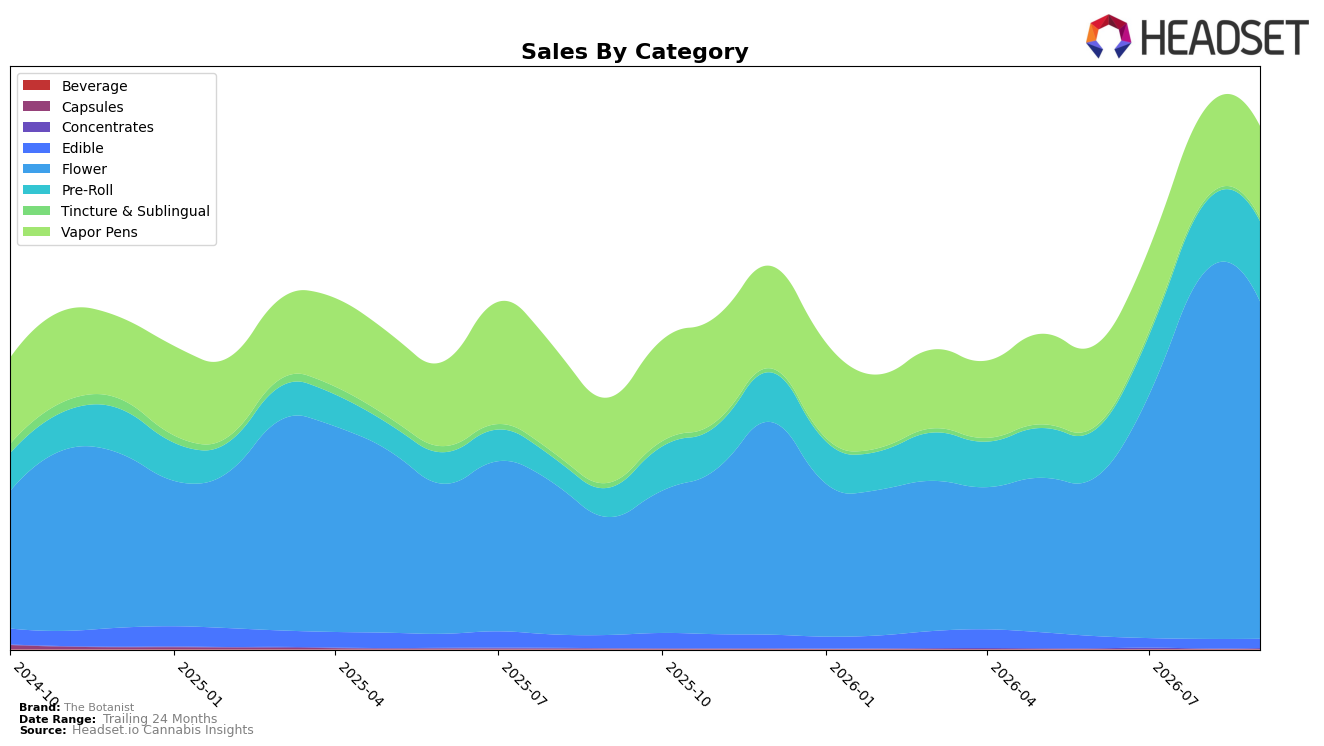
In September 2026, The Botanist concentrated 64.69% of sales in Flower with year-over-year growth of 186.54% but a month-over-month decline of 8.03%, while Vapor Pens held 17.56% share with 7.75% YoY and 1.49% MoM growth. Pre-Roll expanded to 15.35% share on 176.71% YoY and 17.01% MoM growth, whereas Edible contracted to 1.72% share with -30.11% YoY and -1.91% MoM. Niche formats diverged: Tincture & Sublingual slipped to 0.58% share with -34.96% YoY despite a 4.04% MoM uptick, and Concentrates remained 0.11% share but spiked 532.58% YoY and 120.85% MoM. With Flower ranked 4th in Illinois and average price up 9.04% YoY to $27.84, the mix implies The Botanist is deepening its Flower-led scale while selectively accelerating Pre-Roll and maintaining Vapor Pens as a stabilizer.
The pattern points to a pricing-and-format barbell: premiumized Flower (42.59 average price) anchors share even as MoM softens by 8.03%, while value-accessible Pre-Roll (11.84 average price) adds velocity with 17.01% MoM and 176.71% YoY, supporting overall brand sales up 108.94% YoY. Vapor Pens’ modest 1.49% MoM alongside 7.75% YoY suggests retention rather than conquest, whereas Edible’s -30.11% YoY and Tincture & Sublingual’s -34.96% YoY point to deprioritization despite a 4.04% MoM lift in the latter. The outsized but tiny-base Concentrates surge (120.85% MoM, 532.58% YoY) offers an experimentation wedge without diluting the Flower-led rank position at 4 in Illinois, implying the brand’s positioning is shifting toward a two-pillar assortment where high-ticket Flower and high-throughput Pre-Roll carry growth while Pens steady mix and small formats play opportunistic roles.
Competitive Landscape
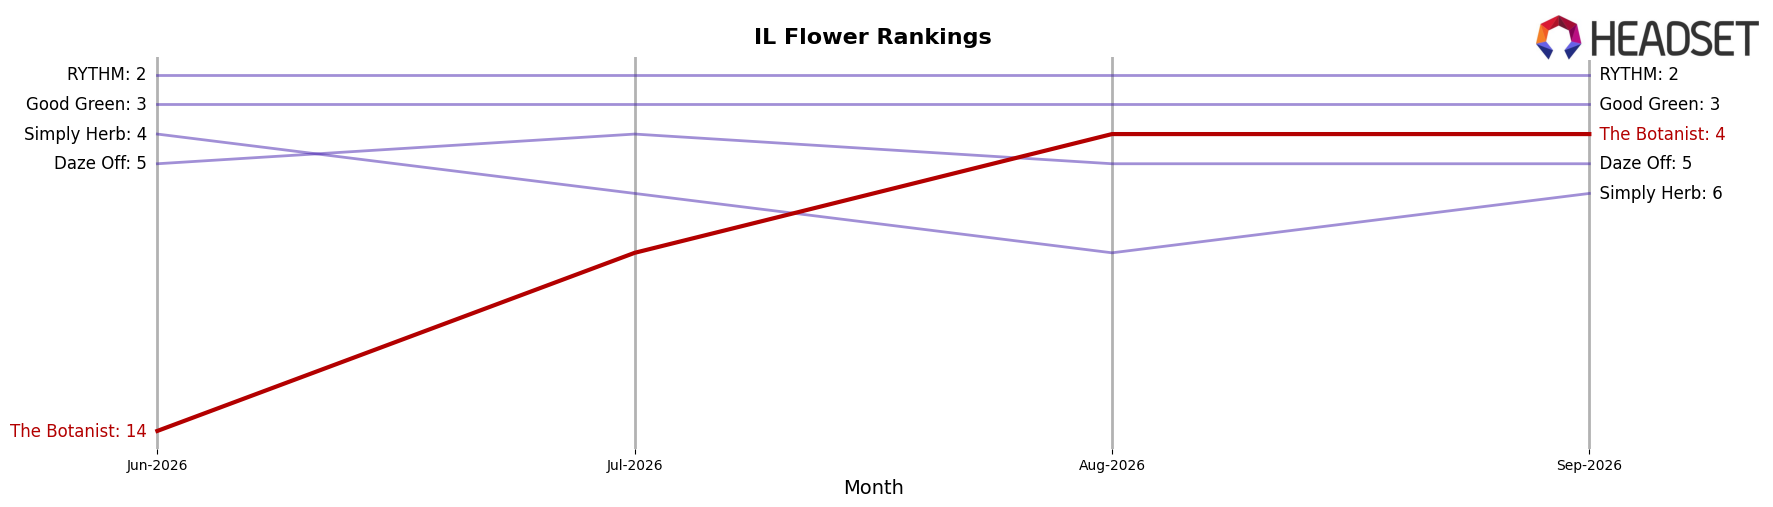
The Botanist sits at rank #4 in Illinois Flower, up 23 places year over year from #27 to #4, and up 10 positions since June 2026 from #14 to #4, marking a new peak at #4 in September 2026; meanwhile, High Supply / Supply held #1 while posting a -2.5% YoY sales change, and Good Green moved from #4 to #3 with a 33.8% YoY sales increase, indicating The Botanist’s rapid climb is driven more by share capture than category expansion and implies continued top-tier contention if the ascent from #27 to #4 sustains against incumbents at #1–#3.
Notable Products
Mint Sherbert (3.5g) posted the steepest movement in September 2026 with a -28.4% month-over-month decline and slid to rank 5, while Billionaire (3.5g) fell -20.5% to rank 4. Grapple Pie (3.5g) also contracted -14.1% yet held rank 2, indicating the Flower tier lost momentum even as LA Pop Rockz Pre-Roll (1g) led the lineup at rank 1. Six of the top ten SKUs are Pre-Roll products, and BrrBerry Pre-Roll (1g) reached rank 8 alongside White Fire x Chem D Pre-Roll (1g) at rank 10, pointing to a share shift toward quick-consumption formats. The pattern implies The Botanist is pivoting mix toward Pre-Rolls to offset double-digit Flower declines and stabilize revenue concentration around higher-velocity items, with only one disclosed dollar figure at $123,334.
Top Selling Cannabis Brands






Data for this report comes from real-time sales reporting by participating cannabis retailers via their point-of-sale systems, which are linked up with Headset’s business intelligence software. Headset’s data is very reliable, as it comes digitally direct from our partner retailers. However, the potential does exist for misreporting in the instance of duplicates, incorrectly classified products, inaccurate entry of products into point-of-sale systems, or even simple human error at the point of purchase. Thus, there is a slight margin of error to consider. Brands listed on this page are ranked in the top twenty within the market and product category by total retail sales volume.

