May-2026
Sales
Trend
6-Month
Product Count
SKUs
Avg Price
YoY Sales Change
YoY Price Change
Market Insights Snapshot
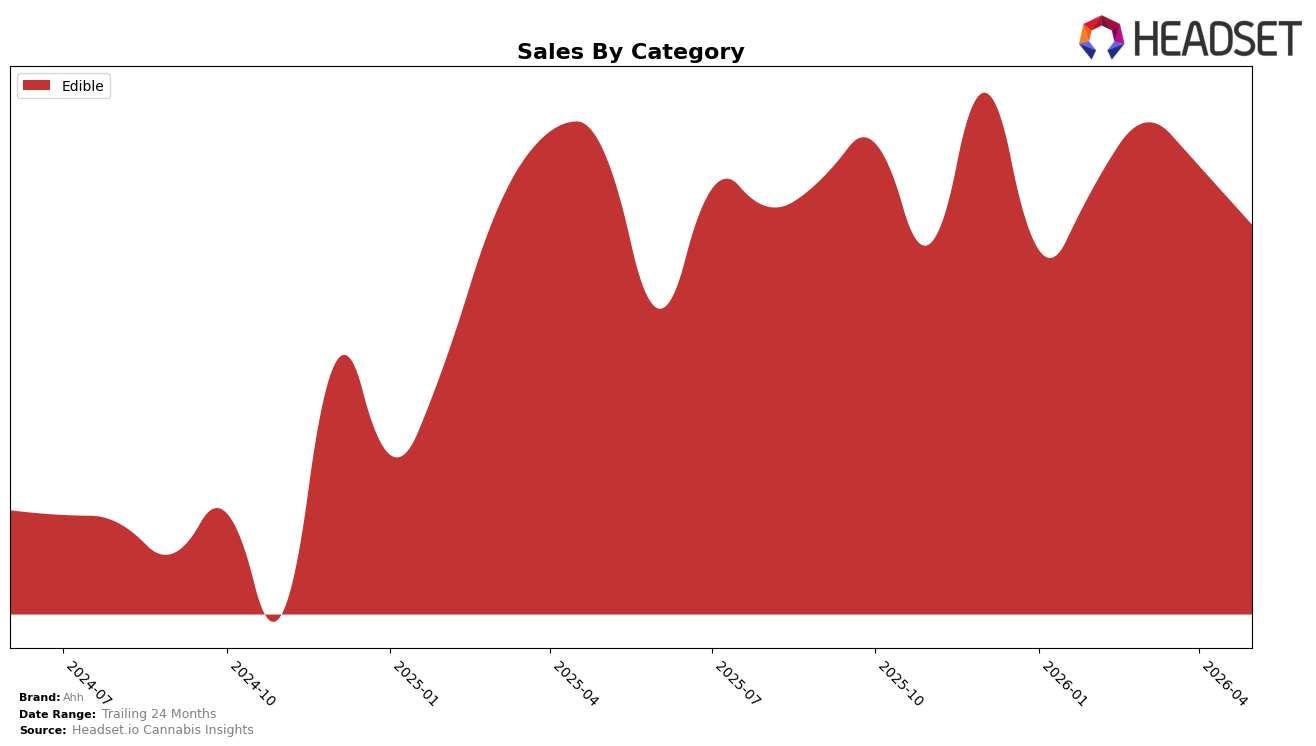
In May 2026, Ahh operated as a single-category brand with Edible accounting for 100.0% of sales, concentrating all mix exposure into one segment while rank sat at 30 in Edible in Massachusetts. Within that focus, year-over-year sales declined 8.0% and month-over-month dipped 6.5%, paired with a 1.3% YoY decrease in average price to $23.85, indicating volume or distribution softness beyond simple pricing. The pattern implies that category concentration amplified downside from Edible-specific headwinds, as a 100.0% mix left no offsetting gains from other categories while the rank of 30 suggests mid-pack pressure rather than incremental share capture.
These shifts point to a positioning anchored in Edibles where small pricing moves (−1.3% YoY) did not counteract volume drag (−8.0% YoY) or the short-term pullback (−6.5% MoM), keeping Ahh at rank 30 without evident momentum. With all sales in Edible and a 24-month sales increase of 11.9% against the latest YoY decline, the trajectory suggests prior gains are at risk of erosion unless mix or subsegment emphasis within Edibles changes to convert price stability into rank improvement. The implication is that sustaining relevance in Edibles requires redistributing effort toward subformats or pack sizes where a modest price edge can translate into share lift rather than continued mid-tier placement.
Competitive Landscape
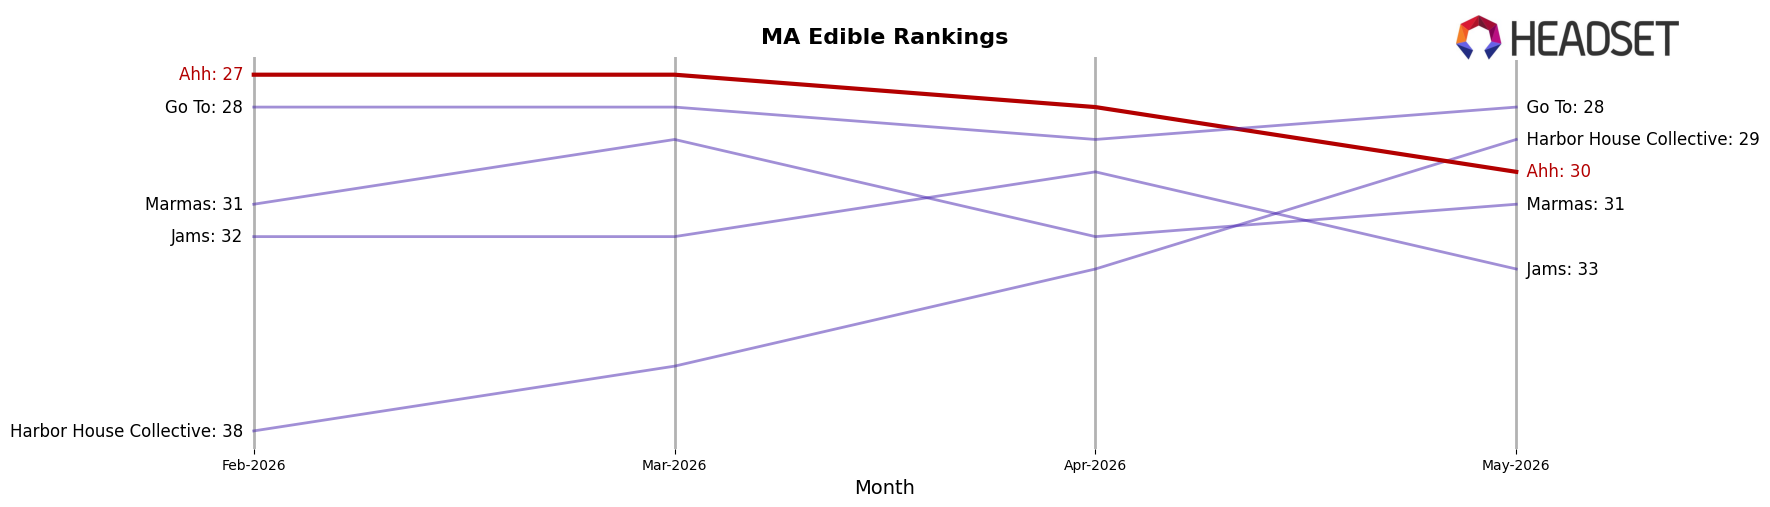
Ahh sits at rank #30 in MA Edible in May 2026, down 3 positions from #27 year over year, and 3 places below its three-month position of #27; this slippage contrasts with peers as Kanha / Sunderstorm moved from #2 to #1 and Wyld climbed from #5 to #3 with 36.6% YoY sales growth, while Betty's Eddies held at #4 despite an 8.9% YoY decline. Compared with Ahh’s peak at #23 in September 2025 and a current position 7 ranks below that peak, competitors’ upward or stable rank trajectories suggest share consolidation at the top, implying that Ahh’s downward drift and failure to recapture a top-25 spot signal increasing displacement risk unless rank momentum reverses.
Notable Products
THC/CBN 4:1 Blueberry Vanilla Dream Dark Chocolate 20-Pack (100mg THC, 25mg CBN) posted the steepest decline at -43.9% and slid to rank 8, while THC/CBN 4:1 Serene Dreams Dark Chocolate Blueberry Vanilla 20-Pack (100mg THC, 25mg CBN) fell -29.0% to rank 6, indicating sleep-oriented CBN formulas lost traction even as the category’s leader Sexy Sativa Raspberry Revive Dark Chocolate Rosin Bar 20-Pack (100mg) dipped -5.5% at rank 1. Offsetting that weakness, THC/CBG 1:1 Sativa Summit Ascent Matcha Quinoa Crunch Milk Chocolate Bar 20-Pack (100mg THC, 100mg CBG) jumped +23.5% into the shared rank 5 band and THC/CBG/THCV 4:2:1 Sky High Chai Cinnamon & Cardamom Milk Chocolate Bar 20-Pack (100mg THC, 50mg CBG, 25mg THCV) grew +22.6% at rank 3, as Caramel Crush Milk Chocolate Rosin Bar 20-Pack (100mg) slipped -9.4% at rank 2 and total May 2026 revenue from the top SKU was $18,659. Four of the top ten are CBG-forward or multi-cannabinoid SKUs, and combined with +13.3% growth from THC/CBG/THCV 4:2:1 Sky High Chai Latte Awakening Milk Chocolate Bar 20-Pack (100mg THC, 50mg CBG, 25mg THCV) at rank 9, the mix points to Ahh tilting toward energizing or daytime effects over sleep-focused offerings.
Top Selling Cannabis Brands
Data for this report comes from real-time sales reporting by participating cannabis retailers via their point-of-sale systems, which are linked up with Headset’s business intelligence software. Headset’s data is very reliable, as it comes digitally direct from our partner retailers. However, the potential does exist for misreporting in the instance of duplicates, incorrectly classified products, inaccurate entry of products into point-of-sale systems, or even simple human error at the point of purchase. Thus, there is a slight margin of error to consider. Brands listed on this page are ranked in the top twenty within the market and product category by total retail sales volume.

