.svg)

Sep-2026
Sales
Trend
6-Month
Product Count
SKUs
Avg Price
YoY Sales Change
YoY Price Change


Where to Buy
Harbor House Collective is stocked at 148 licensed dispensaries across Massachusetts, with the deepest coverage in Worcester, Boston, Fall River, Brockton, and Quincy. Search by ZIP code or city below to find the closest one, or filter by product type if you are after a specific format.
Market Insights Snapshot
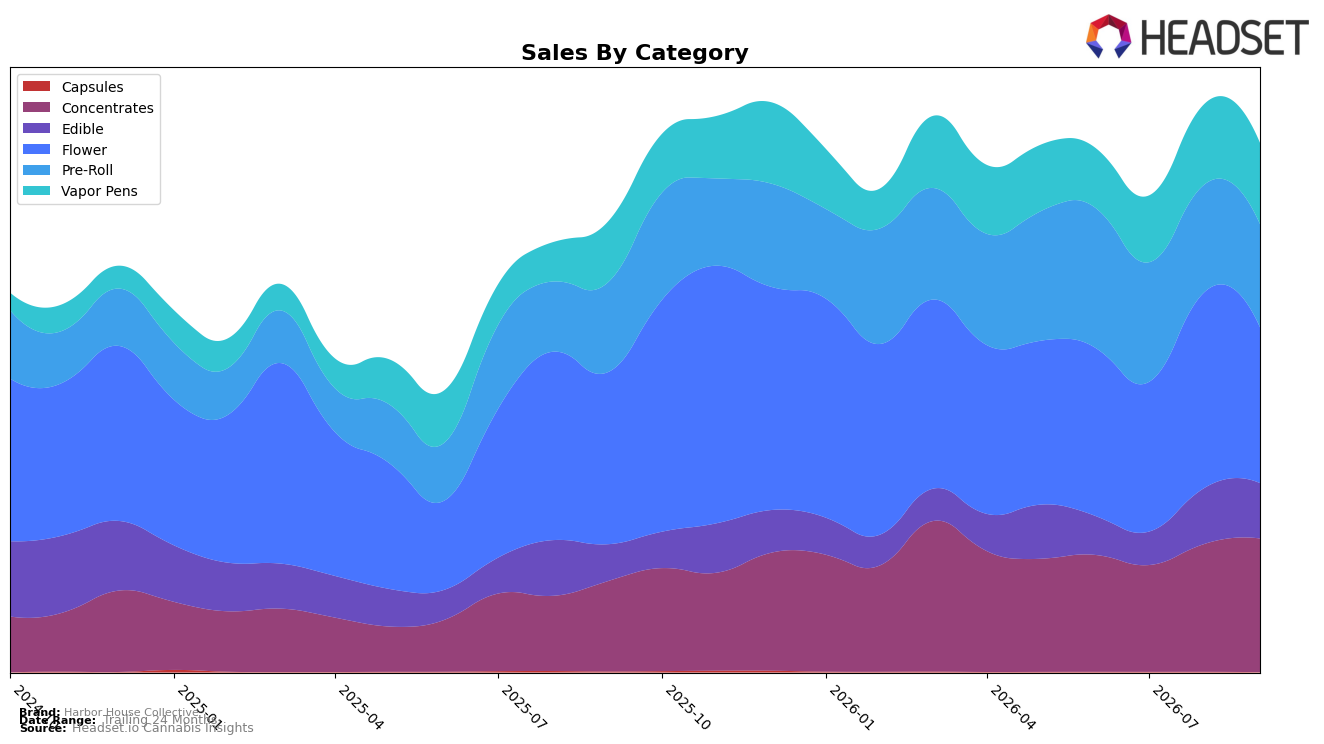
In September 2026, Harbor House Collective’s mix tilted away from Flower as its largest category share at 29.41% contracted with a -9.46% year-over-year decline and a -20.42% month-over-month drop, while Concentrates expanded to 25.23% share on 47.70% YoY growth and 4.48% MoM growth. Pre-Roll held 19.47% share with 14.76% YoY growth but slipped -4.10% MoM, and Vapor Pens accounted for 15.34% share with 33.44% YoY and 0.66% MoM gains; Edible reached 10.46% share with 50.29% YoY growth and a -1.27% MoM dip, as Capsules fell to 0.09% share on -57.79% YoY and -40.94% MoM. With overall brand sales up 17.37% YoY and average price down 11.50% YoY, the pattern implies the brand is leaning into growth in Concentrates, Vapor Pens, and Edible to offset a contracting Flower base, concentrating volume at lower price points to sustain momentum in Massachusetts.
This shift implies a repositioning from Flower-led to multiproduct breadth where higher-growth inhalables and value-oriented formats carry mix and pricing strategy: Concentrates’ 25.23% share and 47.70% YoY growth, alongside Vapor Pens’ 15.34% share and 33.44% YoY growth, indicate heavier emphasis on potency-driven and convenience segments, while the 10.46% Edible share with 50.29% YoY growth supports basket diversification as average price fell 11.50% YoY. Given a Flower rank of 48 in Massachusetts and a -20.42% MoM contraction in that category, the mix suggests the brand’s path to defending total-share relies on share capture in non-Flower inhalables and edibles, using price architecture and assortment depth to reduce dependence on a lagging Flower position.
Competitive Landscape
Harbor House Collective sits at rank 48 in September 2026, slipping 1 position year over year from rank 47 while improving 3 spots from rank 51 over the past three months; against its historical context, the brand is 20 places below its peak at rank 28 in November 2025 and trails the category leaders where Perpetual Harvest climbed from rank 4 to rank 1 as its sales grew 124.1% year over year and Simply Herb fell from rank 1 to rank 3 alongside a 16.6% sales decline. With Farmer's Cut holding rank 2 while growing sales 37.5% and Harbor House Collective offsetting a 1-rank YoY drop with a 3-rank quarter-over-quarter gain, the pattern implies the brand’s position is stabilizing below the top tier and requires share capture from mid-pack incumbents to reverse the downtrend from its November 2025 peak.

Notable Products
Sour Tangie Pre-Roll (1g) posted the steepest decline in September 2026 at -34.6%, sliding to rank 8 while TKO (3.5g) fell -10.2% to rank 5. In contrast, Albariño Pre-Roll (1g) rose 28.5% to rank 2 while Super Boof Pre-Roll (1g) inched up 5.2% at rank 3, and Zeclair Pre-Roll (0.5g) held rank 1 without a reported month-over-month change. With six of the top ten SKUs in the Pre-Roll category, the category concentration indicates Harbor House Collective is leaning into pre-roll velocity while Flower softness limits overall mix resilience. The pattern implies a pivot toward pre-roll-led traffic with selective Flower support, suggesting assortment and promo weight should reinforce fast-moving pre-roll SKUs while addressing volatility pockets like Sour Tangie.
Top Selling Cannabis Brands






Data for this report comes from real-time sales reporting by participating cannabis retailers via their point-of-sale systems, which are linked up with Headset’s business intelligence software. Headset’s data is very reliable, as it comes digitally direct from our partner retailers. However, the potential does exist for misreporting in the instance of duplicates, incorrectly classified products, inaccurate entry of products into point-of-sale systems, or even simple human error at the point of purchase. Thus, there is a slight margin of error to consider. Brands listed on this page are ranked in the top twenty within the market and product category by total retail sales volume.

