.svg)


Where to Buy
Akron Bloom is stocked at 57 licensed dispensaries across New York, with the deepest coverage in New York, Buffalo, Brooklyn, Rochester, and Niagara Falls. Search by ZIP code or city below to find the closest one, or filter by product type if you are after a specific format.
Market Insights Snapshot
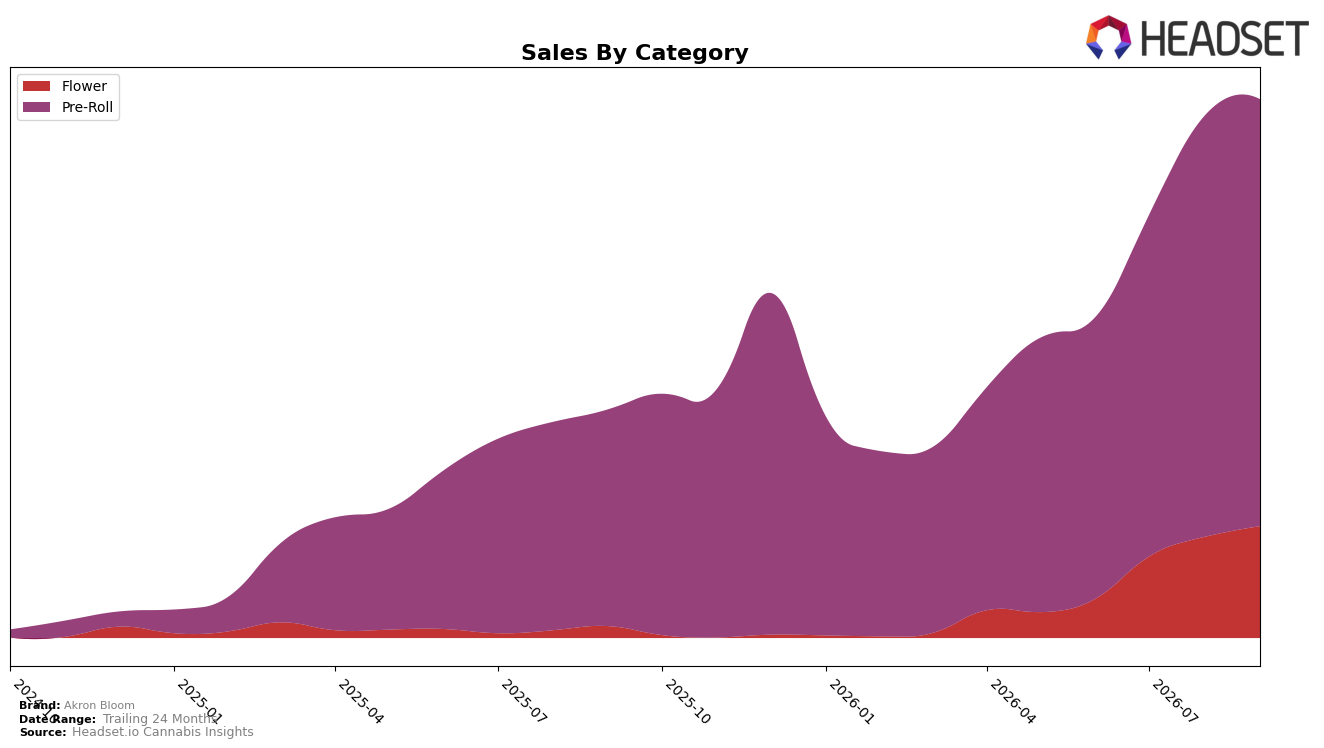
Akron Bloom’s mix in September 2026 is concentrated in Pre-Roll at 79.0% share with 1.38% MoM growth, while Flower holds 21.0% share with a 10.29% MoM increase; on a YoY basis, Pre-Roll rose 96.0% and Flower surged 717.2%. The brand’s overall YoY sales growth of 133.2% sits alongside a 21.2% YoY increase in average price, and within Pre-Roll Akron Bloom is ranked 13th in New York; this combination implies the brand is leaning into a two-tier price architecture where Flower’s high-ticket gains fund broader Pre-Roll reach.
The acceleration in Flower (717.2% YoY vs. 96.0% in Pre-Roll) against a Pre-Roll-heavy base (79.0% share vs. 21.0%) implies Akron Bloom is using Pre-Roll for scale and shelf coverage while shifting incremental growth into higher-price-per-unit Flower (average price 50.33 vs. 8.43), a move that can lift blended margin even as Pre-Roll inches up just 1.38% MoM. Holding the 13th rank in New York Pre-Roll while Flower grows 10.29% MoM suggests the brand’s near-term upside comes from trading consumers up within the portfolio rather than chasing rank gains in the core segment, pointing to a positioning that prioritizes premium trade-up pathways over volume-led rank movement.
Competitive Landscape
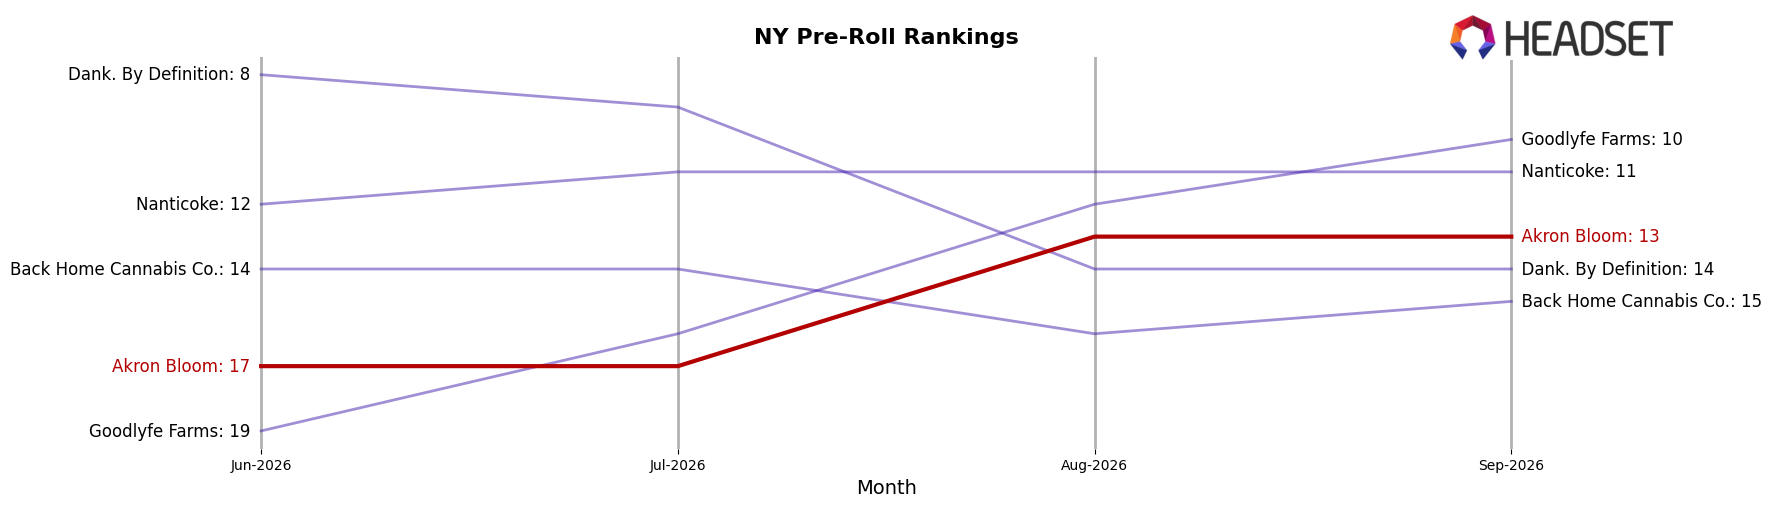
Akron Bloom sits at rank #13 in NY Pre-Roll in September 2026, up 14 positions year over year from #27, and up 4 spots from #17 three months ago; this month also marks its peak rank at #13. In contrast, Jeeter climbed from #6 to #2 with 122% YoY sales growth, while PICC Platform jumped from #54 to #5 alongside a 920% YoY sales increase, indicating that competitors are moving faster up the table. The pattern implies Akron Bloom’s ascent is steady but, given peers’ sharper rank gains and acceleration, maintaining momentum will likely require actions that convert recent rank improvements into larger share captures.
Notable Products
Lemon Kiss Pre-Roll (1g) posted the steepest movement in September 2026 with a -28.99% month-over-month drop and fell to rank 8, while Birthday Cake Pre-Roll (1g) slipped -10.34% at rank 3. In contrast, Leso Espresso Pre-Roll (1g) gained 15.33% to hold rank 1 and Mafia Hits Pre-Roll (1g) climbed 27.96% at rank 6, indicating volatility concentrated within the same format. With nine of the top ten being Pre-Roll SKUs and only one Flower entry at rank 10, the mix implies Akron Bloom is consolidating around flavor-led Pre-Rolls while allowing single Flower placements to play a supporting role rather than a volume driver.
Top Selling Cannabis Brands






Data for this report comes from real-time sales reporting by participating cannabis retailers via their point-of-sale systems, which are linked up with Headset’s business intelligence software. Headset’s data is very reliable, as it comes digitally direct from our partner retailers. However, the potential does exist for misreporting in the instance of duplicates, incorrectly classified products, inaccurate entry of products into point-of-sale systems, or even simple human error at the point of purchase. Thus, there is a slight margin of error to consider. Brands listed on this page are ranked in the top twenty within the market and product category by total retail sales volume.

