Market Insights Snapshot
Canna Cure Farms has shown a fluctuating performance across different categories and states, with notable movements in the rankings. In the Flower category in New York, the brand did not make it into the top 30 rankings from October to December 2025, which could indicate a challenging market environment or increased competition. This absence from the top 30 is a potential area of concern, as it highlights the need for strategic adjustments to regain visibility and market share in this category.
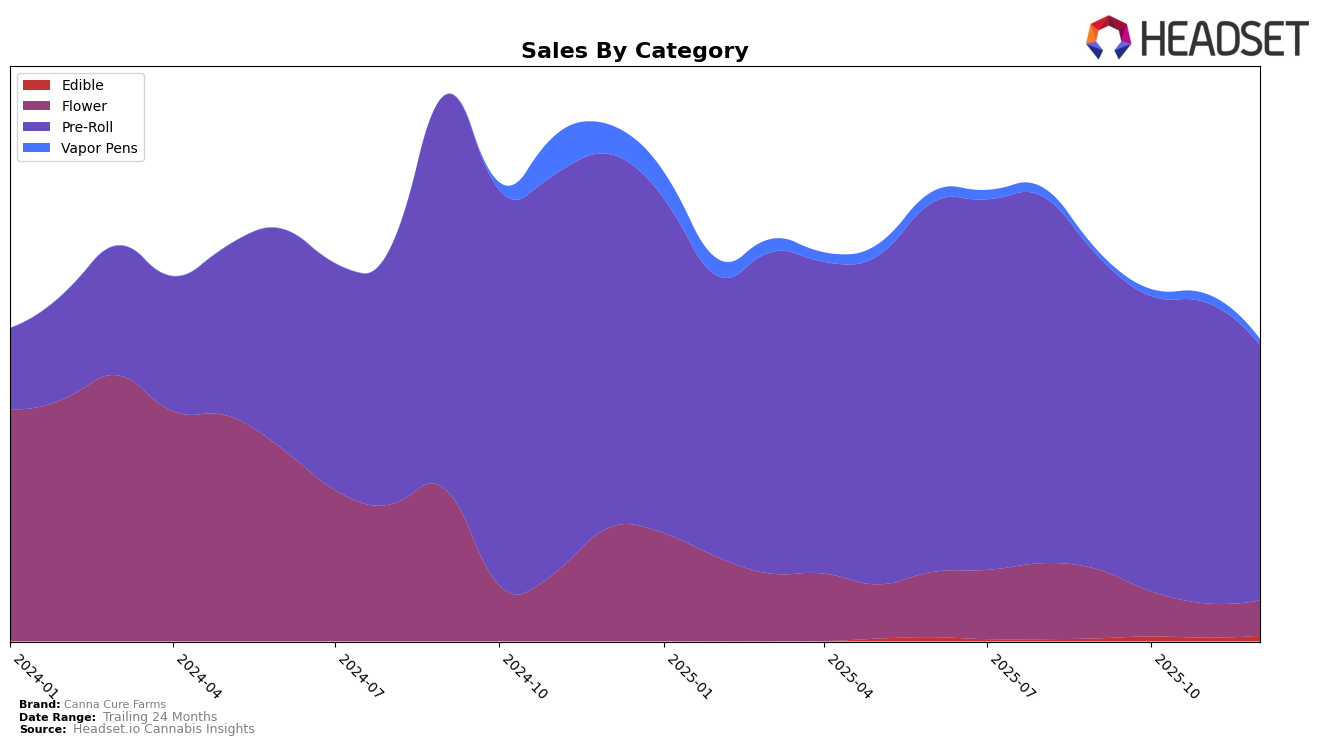
Conversely, in the Pre-Roll category in New York, Canna Cure Farms has maintained a relatively stable position within the top 20 throughout the last quarter of 2025. Starting at rank 15 in September, the brand experienced a slight dip to rank 16 in October, then returned to rank 15 in November, and finally settled at rank 20 in December. Despite a decline in sales from September to December, the ability to remain within the top 20 suggests a strong brand presence and consumer loyalty in this category. This stability in Pre-Roll rankings might provide insights into successful strategies that could be leveraged to improve performance in other categories.
Competitive Landscape
In the competitive landscape of the New York pre-roll category, Canna Cure Farms has experienced notable fluctuations in its market position over the last few months of 2025. Starting in September, Canna Cure Farms held a respectable rank of 15th, but by December, it had slipped to 20th, indicating increased competition and potential challenges in maintaining market share. This decline in rank coincides with a decrease in sales, contrasting with competitors like Electraleaf, which improved its rank from 28th in September to 18th in December, showcasing a significant upward trajectory in sales. Meanwhile, Toast and Lil Lefty's have maintained relatively stable positions, suggesting consistent performance in the market. The data highlights the dynamic nature of the pre-roll segment in New York, where Canna Cure Farms faces the challenge of regaining its earlier momentum amidst rising competition.

Notable Products
In December 2025, Blueberry Runtz Pre-Roll (1g) maintained its top position from November with sales amounting to 4922 units, showcasing its consistent popularity. Blue Dream Pre-Roll (1g) held steady at the second spot, though its sales saw a decline compared to previous months. Pineapple Express Pre-Roll (1g) remained in third place, indicating stable demand despite a slight drop in sales figures. Strawberry Runtz Pre-Roll (1g) continued its descent, holding the fourth position after leading in earlier months. Sour Diesel Pre-Roll (1g) reappeared in the rankings at fifth place, marking a return after disappearing from the list in November.
Top Selling Cannabis Brands
Data for this report comes from real-time sales reporting by participating cannabis retailers via their point-of-sale systems, which are linked up with Headset’s business intelligence software. Headset’s data is very reliable, as it comes digitally direct from our partner retailers. However, the potential does exist for misreporting in the instance of duplicates, incorrectly classified products, inaccurate entry of products into point-of-sale systems, or even simple human error at the point of purchase. Thus, there is a slight margin of error to consider. Brands listed on this page are ranked in the top twenty within the market and product category by total retail sales volume.

