Jun-2026
Sales
Trend
6-Month
Product Count
SKUs
Avg Price
YoY Sales Change
YoY Price Change
Market Insights Snapshot
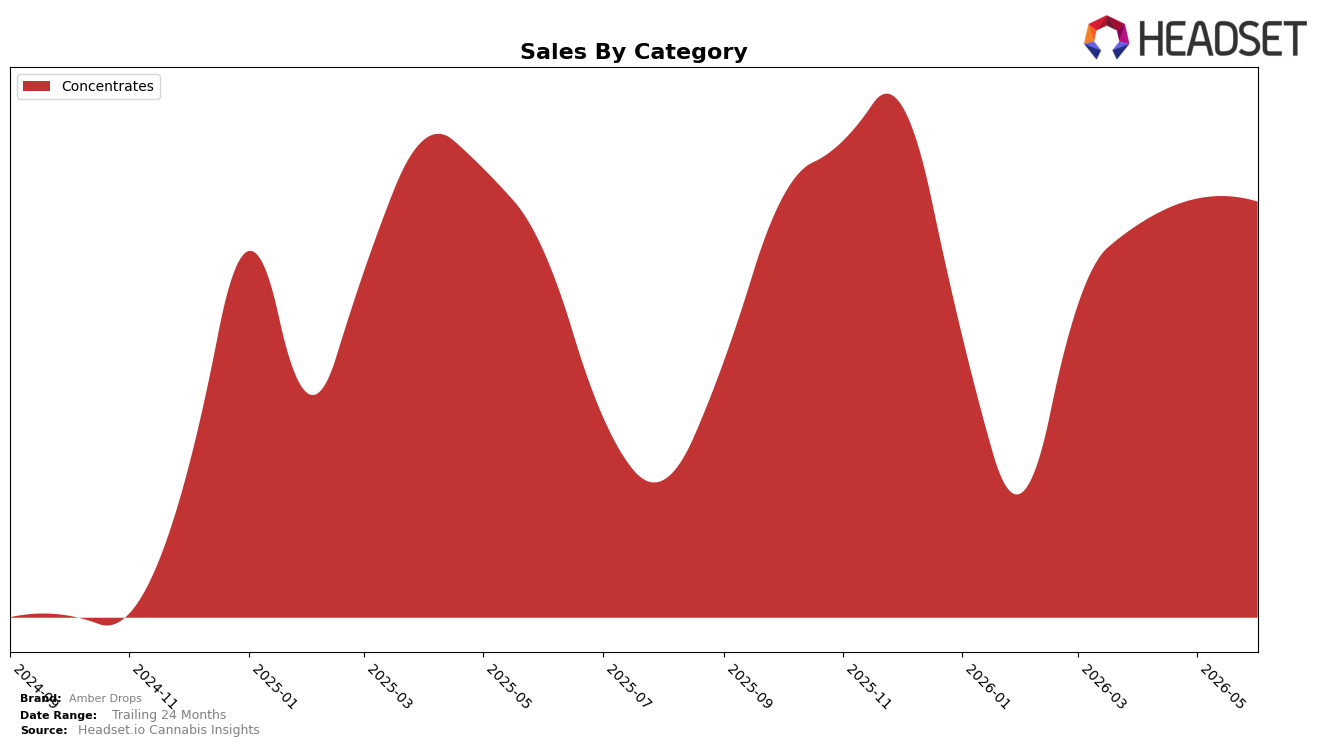
Amber Drops operated as a single-category brand in Concentrates during June 2026, with Concentrates accounting for 100.0% of sales and a year-over-year sales change of 13.7% alongside a month-over-month decline of 0.7%. Average price fell 7.4% year over year to $3.31 while the category share remained at 100.0%, indicating volume expansion outpacing price compression; the combination produced overall brand sales growth of 13.7% YoY but a modest MoM contraction of 0.7%. The brand ranked 28 in Concentrates in Washington, a position that, paired with price deflation and flat category breadth, implies volume-led gains that are sensitive to monthly demand dips.
The consolidation in a single category with a 100.0% mix and a rank of 28 within Washington positions Amber Drops as a price-accessible, volume-driven Concentrates player rather than a diversified portfolio bet, as evidenced by a 7.4% YoY price decrease coinciding with a 13.7% YoY sales increase and a 0.7% MoM pullback. This pattern implies that future share gains will hinge on sustaining low-price elasticity and improving rank within Concentrates, because the current mix leaves no buffer from other categories and small MoM declines can directly pressure standing at rank 28.
Competitive Landscape
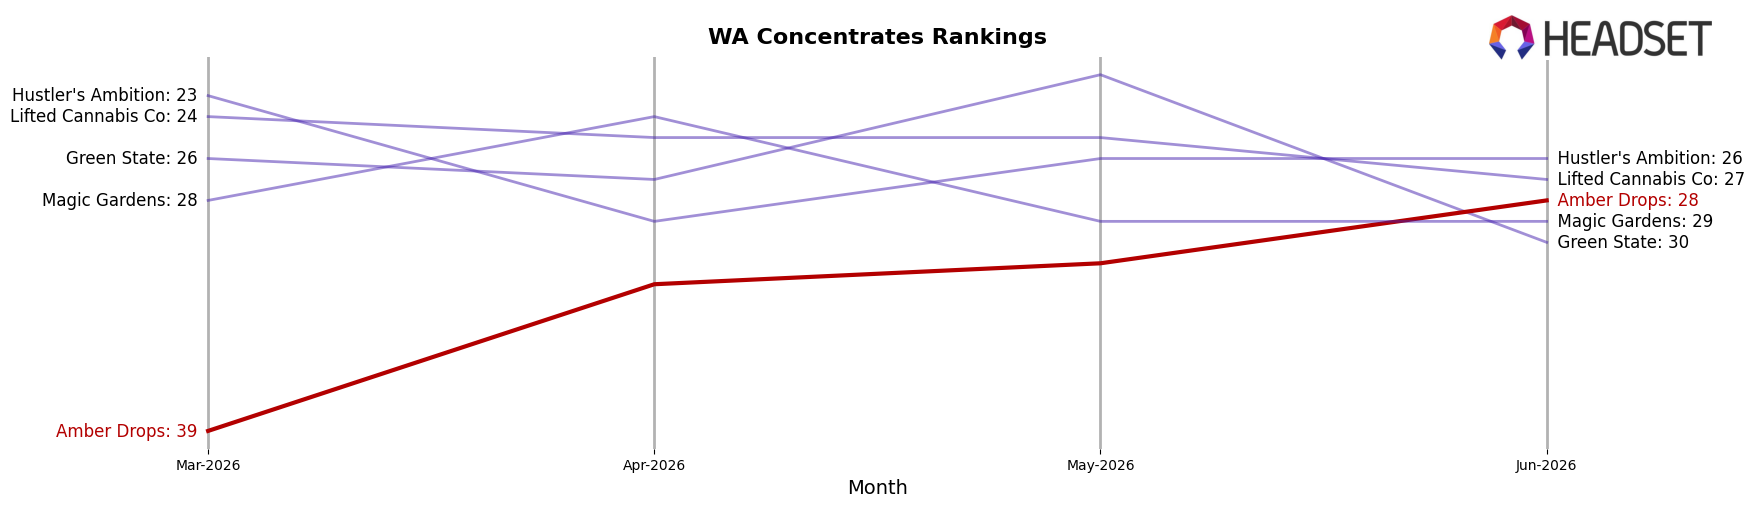
Amber Drops sits at rank #28 in WA Concentrates in June 2026, improving 1 position from #29 year over year, and rising 11 positions from #39 since March 2026; against its own history, this is still 8 spots below its peak rank of #20 in November 2025 and 27 places behind category leader Ooowee, which held #1 both year over year and in June 2026. Competitive movement underscores the bar for ascent: Constellation Cannabis advanced from #7 year over year to #3 in June 2026 with 44.1% YoY sales growth, while Dabstract climbed from #5 YoY to #4 with 23.5% YoY growth, indicating that Amber Drops’ 1-rank YoY improvement and 11-rank three-month rebound need to translate into sustained share capture to avoid flattening below its November 2025 ceiling.
Notable Products
Kimbo Kush Wax (1g) sets the tone with a -12.1% month-over-month decline in June 2026 while holding rank 8, contrasting with Chocolate Wedding Cake Wax (1g) at rank 1 on +8.7% and Peanut Butter Breath BHO Wax (1g) at rank 2 on +2.1%. Four of the top ten are Concentrates within ranks 1–5 and 6–10, and the category’s mix shows modest gains at the top alongside mid-tier pressure, implying a tilt toward a narrower set of winners rather than broad-line lift. Chocolate Wedding Cake Wax (1g) leads the lineup at $9,272 and extends its lead over OG Chem Wax (1g) at rank 3 on +3.4%, signaling that incremental share is consolidating in the flagship while underperformers are being de-emphasized. Taken together, a leader-heavy profile with a double-digit laggard implies Amber Drops is concentrating demand around a few marquee Concentrates to stabilize rank positions and trim weaker SKUs.
Top Selling Cannabis Brands
Data for this report comes from real-time sales reporting by participating cannabis retailers via their point-of-sale systems, which are linked up with Headset’s business intelligence software. Headset’s data is very reliable, as it comes digitally direct from our partner retailers. However, the potential does exist for misreporting in the instance of duplicates, incorrectly classified products, inaccurate entry of products into point-of-sale systems, or even simple human error at the point of purchase. Thus, there is a slight margin of error to consider. Brands listed on this page are ranked in the top twenty within the market and product category by total retail sales volume.

