.svg)

Sep-2026
Sales
Trend
6-Month
Product Count
SKUs
Avg Price
YoY Sales Change
YoY Price Change


Where to Buy
Sitka is stocked at 173 licensed dispensaries across Washington, California, and 2 other states, 138 of them in Washington, with the deepest coverage in Seattle, Spokane, Tacoma, Bellingham, and Olympia. Search by ZIP code or city below to find the closest one, or filter by product type if you are after a specific format.
Market Insights Snapshot
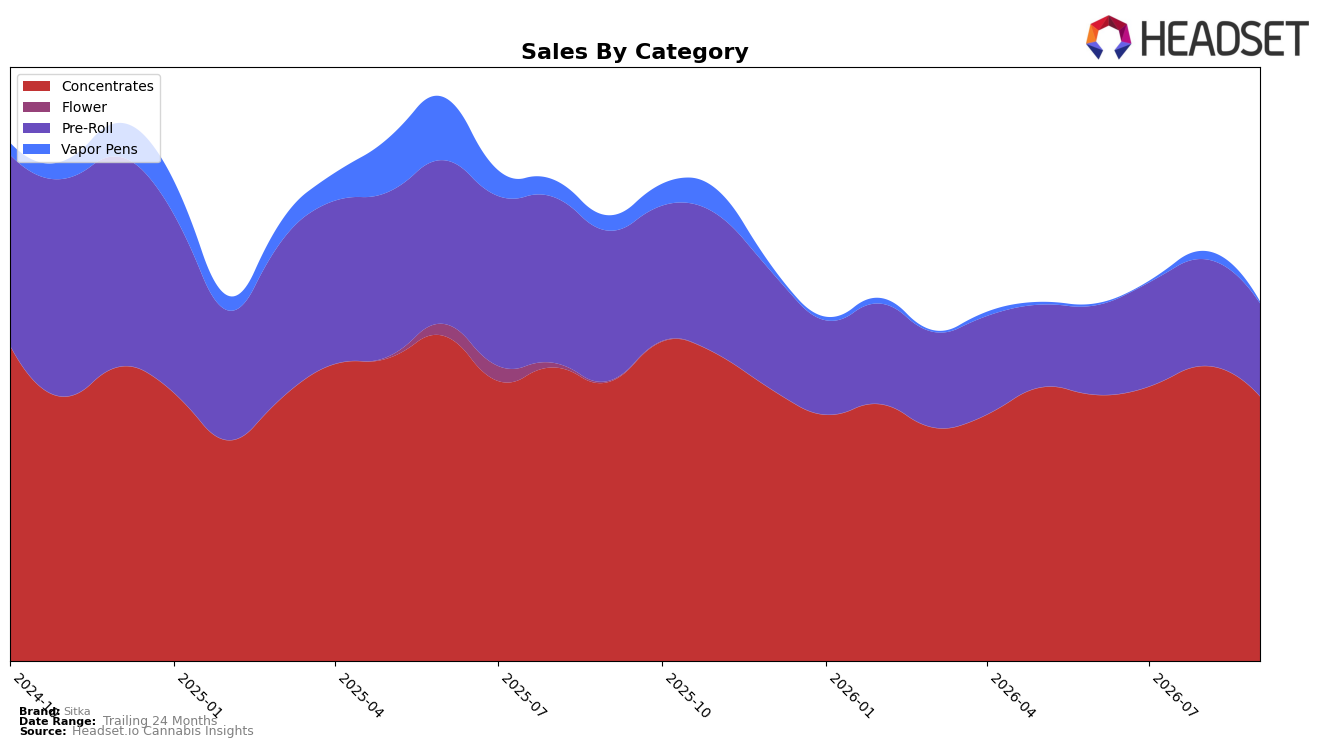
Sitka’s category mix in September 2026 is concentrated, with Concentrates at 73.73% share and ranked 26th in Washington, while Pre-Roll holds 25.82% and Vapor Pens just 0.46%. Year over year, Concentrates declined 5.15% and Pre-Roll fell 38.29%, and month over month both contracted further at 10.28% and 12.96% respectively; Vapor Pens dropped 89.15% YoY and 79.51% MoM. Against this backdrop, average price rose 5.15% YoY to $17.41 as overall brand sales fell 19.36% YoY, implying mix pressure from shrinking Pre-Roll volume and a rapid exit from Vapor Pens, with category dependence in Washington limiting offset when Concentrates soften.
The shift concentrates risk: a 73.73% reliance on Concentrates paired with a 26th rank in Washington suggests limited pricing or distribution leverage, while the 38.29% YoY decline in Pre-Roll erodes a key secondary demand pool and the 79.51% MoM contraction in Vapor Pens removes trial at the perimeter. With brand sales down 19.36% YoY and average price up 5.15% YoY, the pattern implies a tilt toward higher ticket Concentrates without sufficient unit velocity, so near-term positioning hinges on stabilizing Concentrates share while rebalancing mix away from the steeply contracting Pre-Roll and near-zero Vapor Pens.
Competitive Landscape
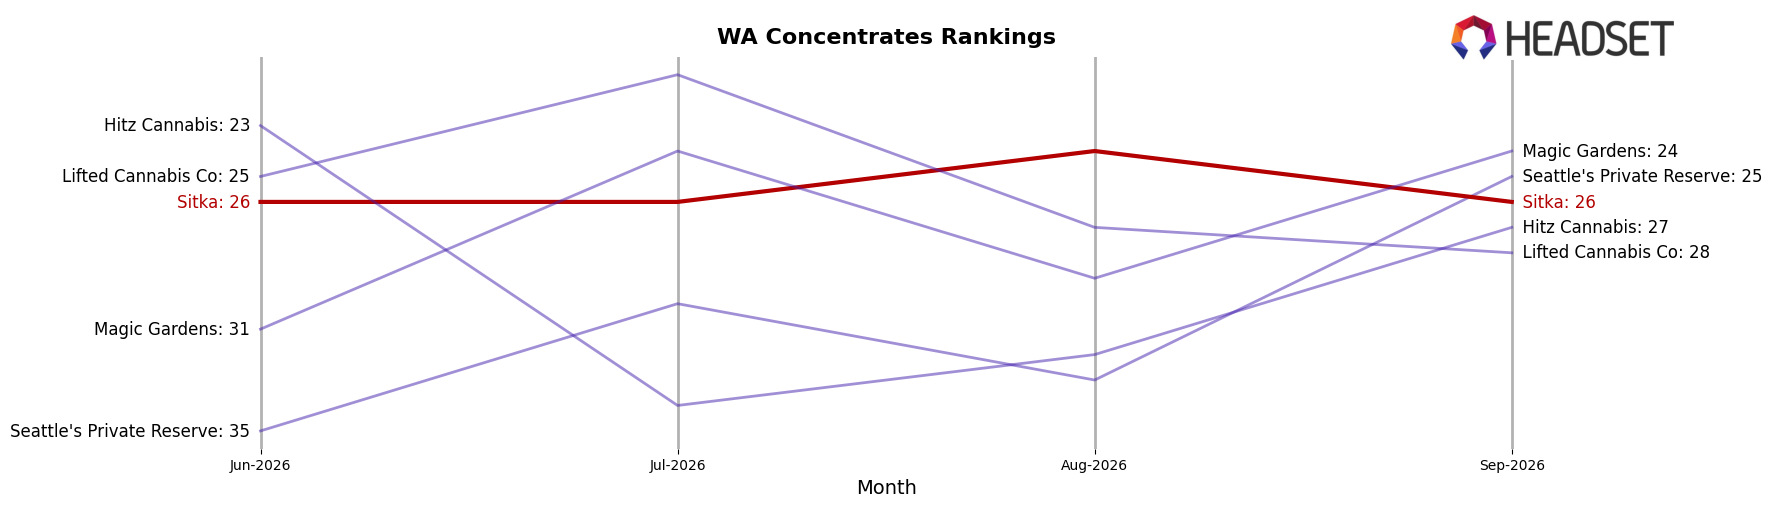
Sitka sits at rank #26 in WA Concentrates in September 2026, slipping 1 position year over year from #25 while holding flat versus June 2026 at #26; this leveling comes despite the category’s top end shifting, with Ooowee holding #1 but posting a -7.84% YoY sales change and Constellation Cannabis advancing to #5 from #11 alongside an 88.81% YoY lift. Sitka’s current #26 also trails its peak #19 from August 2025, indicating a 7-rank slide from peak while competitors like Buddy Boy Farms surged to #4 from #49 on a 464.53% YoY increase; this mix of upward mobility at the top and negative growth at #1 implies Sitka’s stagnant rank trajectory reflects share consolidation among fast-rising players rather than broad category expansion.
Notable Products
Classic Lebanese Gold Hashish Infused Pre-Roll (1g) posted the steepest decline in September 2026 at -38.4%, while Cascade Cream Hashish (1g) fell even further at -39.7% to cap a broader pullback in non-core items; by contrast, Lebanese Gold Hash (1g) rose 20.6% to rank 3 as Classic - Lebanese Red Hash (1g) held rank 1 despite a -6.3% dip. Four of the top ten are Pre-Roll SKUs, yet three of those contracted between -12.1% and -39.7% while the best momentum sat in Concentrates, where Lebanese Red Dry Sift Hash (1g) grew 4.6% and Classic - Cascade Cream Hash (1g) sank -27.1%. The concentration of rank 1–3 in Concentrates alongside double-digit Pre-Roll declines indicates Sitka’s volume is consolidating in flagship hash formats rather than infused extensions.
Top Selling Cannabis Brands






Data for this report comes from real-time sales reporting by participating cannabis retailers via their point-of-sale systems, which are linked up with Headset’s business intelligence software. Headset’s data is very reliable, as it comes digitally direct from our partner retailers. However, the potential does exist for misreporting in the instance of duplicates, incorrectly classified products, inaccurate entry of products into point-of-sale systems, or even simple human error at the point of purchase. Thus, there is a slight margin of error to consider. Brands listed on this page are ranked in the top twenty within the market and product category by total retail sales volume.

