.svg)

Sep-2026
Sales
Trend
6-Month
Product Count
SKUs
Avg Price
YoY Sales Change
YoY Price Change


Where to Buy
Amy & Al's is stocked at 16 licensed dispensaries across Arizona, with the deepest coverage in Phoenix, Apache Junction, Tucson, Flagstaff, and Kingman. Search by ZIP code or city below to find the closest one.
Market Insights Snapshot
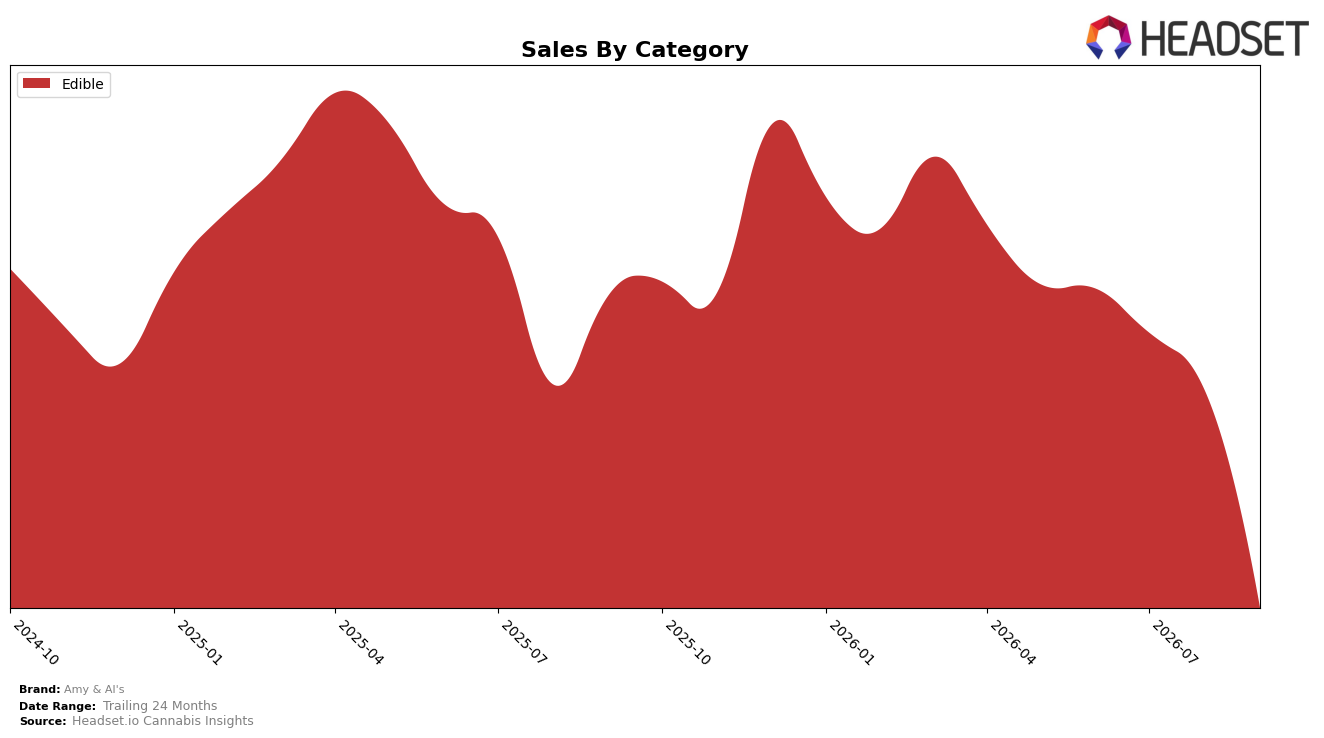
In September 2026, Amy & Al's operated as a single-category brand with Edible at 100.0% mix, while Edible sales fell 63.1% year over year and 54.4% month over month; alongside this volume contraction, average price rose 6.2% YoY to $9.30, indicating price firming amid demand pressure. Within the Arizona Edible context, the brand sat at rank 30, a position that, combined with a full-category concentration and simultaneous double-digit YoY and MoM declines, implies the current mix amplifies exposure to category-specific headwinds and limits offset from other formats.
The combination of a 100.0% Edible mix and a 30th-place standing in Arizona Edibles suggests that September 2026 pricing power (+6.2% YoY) is not translating into rank protection amid a 54.4% MoM and 63.1% YoY sales contraction; this gap implies demand elasticity or share loss within Edibles rather than a broad brand pullback. Given zero diversification across categories and rapid month-over-month decline, the pattern points to a positioning reliant on a narrow set of Edible occasions where small pricing moves can disproportionately impact volume, signaling a need to adjust pack/price architecture or expand formats to stabilize rank trajectory.
Competitive Landscape
Amy & Al's ranks #30 in AZ Edible in September 2026, down 11 spots year over year from #19, and 8 spots below its June 2026 position of #22; the brand’s peak of #16 in July 2025 further marks a 14-place slide from its historical best. In contrast, Wyld held #1 both this year and last (flat in rank despite a -16.2% YoY sales change), while Baked Bros moved up from #4 to #2 with +22.5% YoY sales, indicating that incumbents and climbers are consolidating share above Amy & Al's. With rank retreating 11 places YoY and 8 places in three months, the trajectory implies a loss of visibility in mid-tier slots and a need to reverse share leakage against faster-rising competitors.

Notable Products
Hybrid Brownie 10-Pack (100mg) led with a steep -60.9% month-over-month drop yet still held rank 1, while Hybrid Chocolate Chip Cookie 10-Pack (100mg) fell -34.4% to rank 3; the absence of any +50% risers makes the downturn the defining movement. Hybrid Snickerdoodle Cookies 10-Pack (100mg) was the lone gainer at +12.2% and rank 2, and Hybrid Peanut Butter Cookie 10-Pack (100mg) slid -31.9% at rank 4, concentrating four of the top five in cookie and brownie formats that are under pressure together. Edibles remained the entire top tier with five ranked SKUs, but only one posted growth as Milk Chocolate Brownie 10-Pack (100mg) was flat at -0.2% and Hybrid Honey (100mg) in rank 5 grew just +9.7%, signaling weak breadth across formats. This mix points to a reliance on legacy brownies and cookies that is losing momentum, implying a near-term need to rebalance toward fewer, faster-moving SKUs rather than defending breadth.
Top Selling Cannabis Brands






Data for this report comes from real-time sales reporting by participating cannabis retailers via their point-of-sale systems, which are linked up with Headset’s business intelligence software. Headset’s data is very reliable, as it comes digitally direct from our partner retailers. However, the potential does exist for misreporting in the instance of duplicates, incorrectly classified products, inaccurate entry of products into point-of-sale systems, or even simple human error at the point of purchase. Thus, there is a slight margin of error to consider. Brands listed on this page are ranked in the top twenty within the market and product category by total retail sales volume.

