.svg)


Market Insights Snapshot
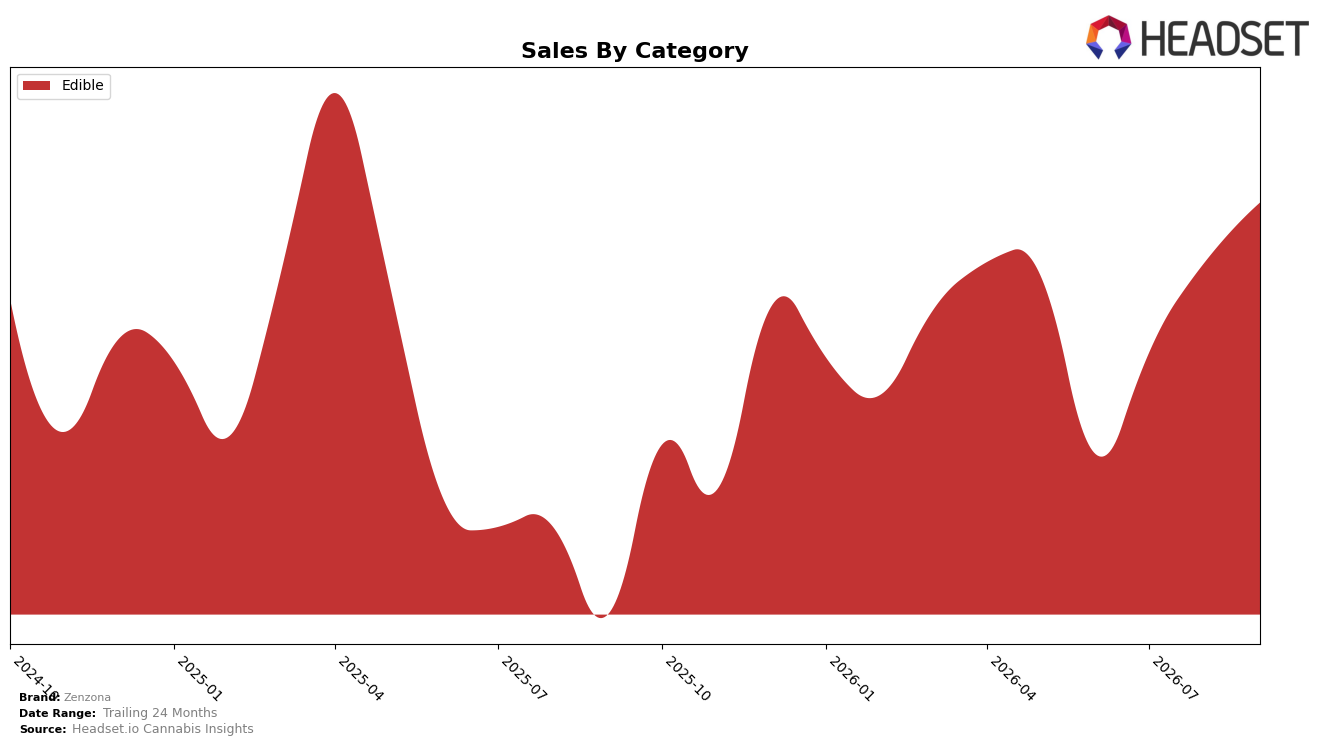
In September 2026, Zenzona operated as a single-category brand with Edible accounting for 100.0% of sales, while average price declined 5.1% year over year alongside a 47.9% sales increase year over year. Month over month, Edible sales rose 4.9% as pricing held at $8.97 and share concentration remained at 100.0%, indicating volume gains outpaced price compression. The pattern implies volume-led expansion within a focused portfolio, with pricing elasticity supporting demand rather than mix diversification.
Within Arizona Edibles, a rank of 9 coupled with a 47.9% year-over-year sales lift and a 4.9% month-over-month gain suggests Zenzona is climbing the mid-tier while relying on a single format. The 5.1% price decrease against double-digit growth signals a price-to-volume tradeoff that is sustaining rank stability at 9 rather than immediate rank acceleration, implying the brand’s positioning hinges on value-accessible Edibles and would require either mix expansion or further velocity gains to break into higher ranks.
Competitive Landscape
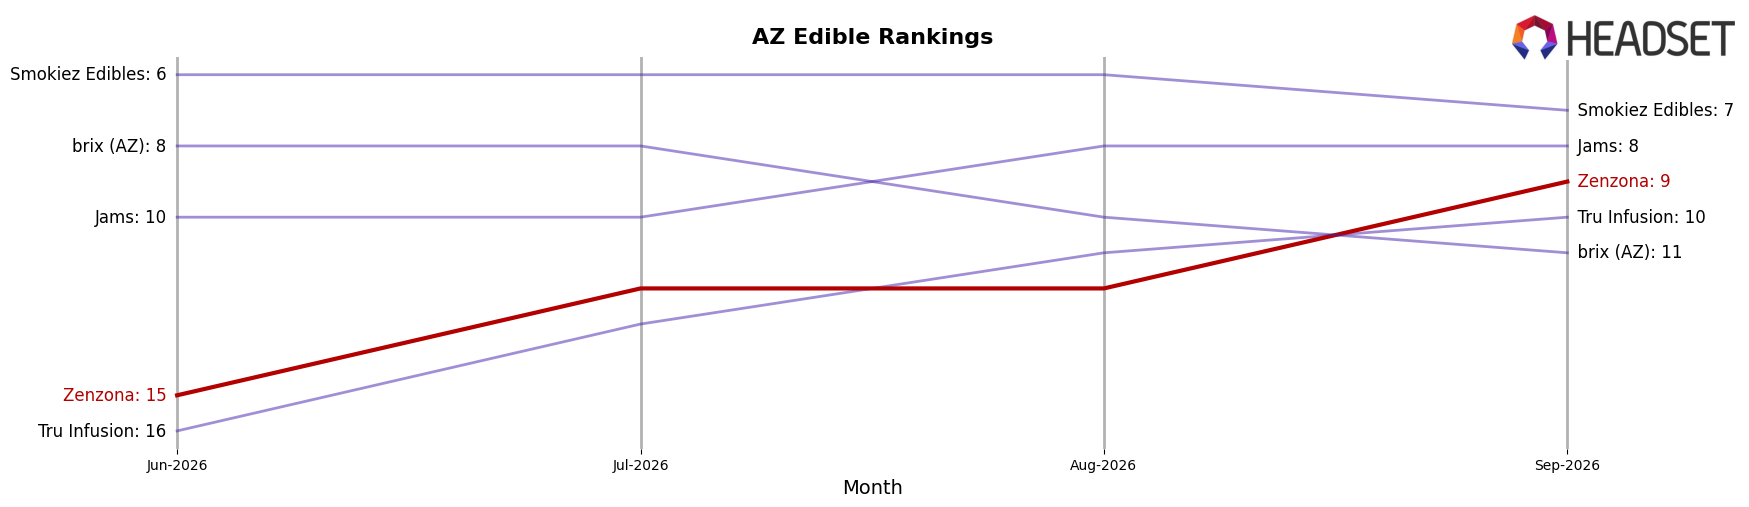
Zenzona sits at rank #9 in AZ Edible in September 2026, up 5 spots from #14 in September 2025, and 6 spots from #15 in June 2026, marking its peak rank to date at #9 in September 2026; meanwhile, category leader Wyld held #1 year over year but saw sales decline 16.2%, while Baked Bros climbed from #4 to #2 with 22.5% sales growth, indicating Zenzona’s upward rank movement is occurring as one top competitor softens and another accelerates. With OGEEZ slipping from #2 to #3 on a 8.0% sales drop and Wana holding steady at #5 with 14.4% growth, Zenzona’s advance from #15 to #9 over three months and from #14 to #9 year over year implies the brand is converting mid-tier volatility into share opportunity rather than chasing the top-two pace.
Notable Products
Hybrid Blackberries and Cream RSO Vegan Gummies 10-Pack (100mg) posted the steepest decline at -9.31% while sliding to rank 4, as Pineberry Vegan RSO Gummies 10-Pack (100mg) held rank 1 with a -6.70% dip, signaling a reshuffle among flagship SKUs. Offsetting that softness, Sativa Raspberry Vegan Gummies 10-Pack (100mg) climbed to rank 3 on +16.99% and CBD/THC 1:1 Cherry Vegan Gummies 10-Pack (100mg CBD, 100mg THC) advanced within the top 10 on +14.29%, with Edibles accounting for all top-10 placements and indicating category concentration is driving share stability. With the leader at $35,056 and multiple mid-pack SKUs posting +8–18% gains, the mix points to momentum favoring fruit-forward profiles and balanced/CBD-leaning ratios even as the top SKU cools, implying Zenzona is tilting toward breadth within a single category rather than reliance on a single hero item.
Top Selling Cannabis Brands






Data for this report comes from real-time sales reporting by participating cannabis retailers via their point-of-sale systems, which are linked up with Headset’s business intelligence software. Headset’s data is very reliable, as it comes digitally direct from our partner retailers. However, the potential does exist for misreporting in the instance of duplicates, incorrectly classified products, inaccurate entry of products into point-of-sale systems, or even simple human error at the point of purchase. Thus, there is a slight margin of error to consider. Brands listed on this page are ranked in the top twenty within the market and product category by total retail sales volume.

