Market Insights Snapshot
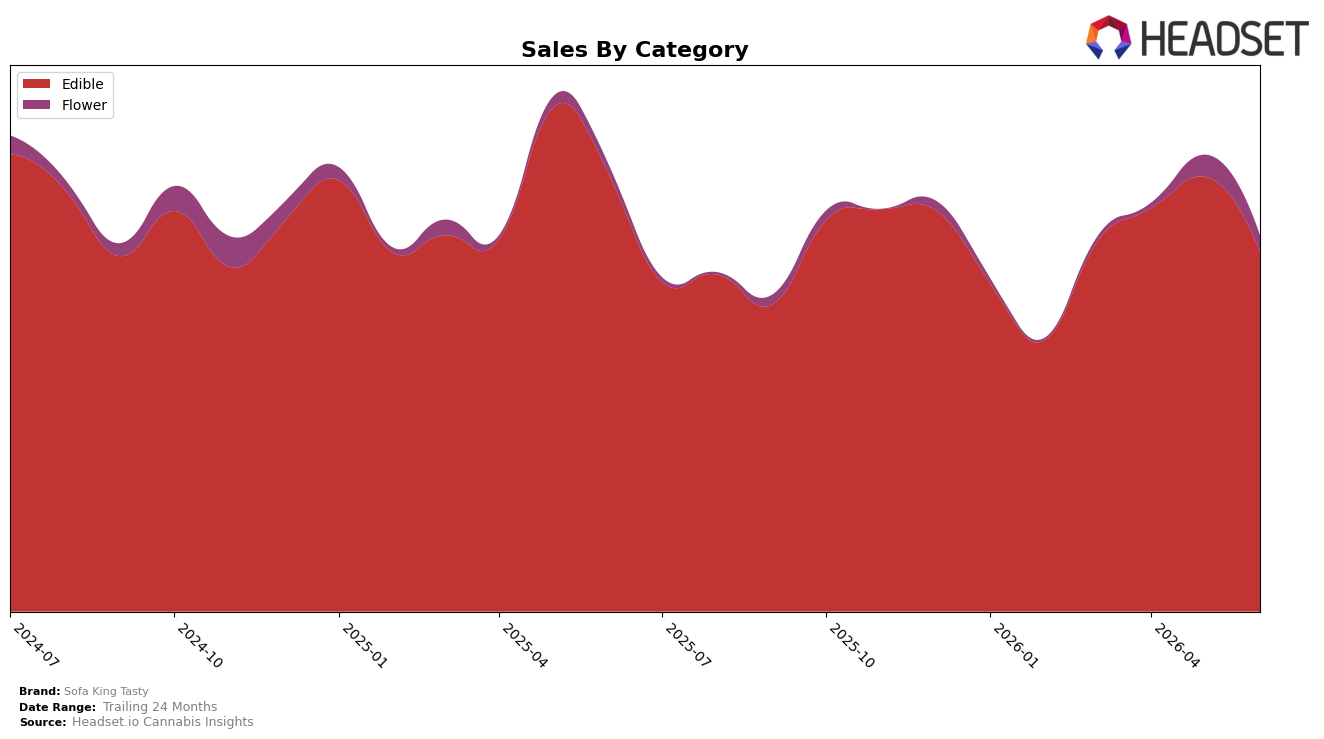
In June 2026, Sofa King Tasty concentrated 91.98% of sales in Edible, down 17.40% year over year and 16.73% month over month, while Flower held 8.02% share with a 29.08% year-over-year increase but a 13.53% month-over-month decline. The brand’s average price fell 5.08% year over year to $8.96, and within Edible the average price sat at $9.02 versus $8.28 in Flower, indicating mix and pricing pressure concentrated in the Edible core. The thesis is that a heavy Edible reliance combined with concurrent MoM declines across both categories signals exposure to category headwinds rather than a single-product issue.
With Edible anchoring the portfolio and a rank of 16 in Edible in Arizona, the June 2026 drop suggests that Sofa King Tasty’s positioning is tethered to a shrinking core while the smaller Flower line, despite +29.08% YoY, is too small at 8.02% share to offset mix drag. Given brand sales down 14.95% year over year and a 24‑month change of −16.41%, the combination of lower prices (−5.08% YoY) and a declining Edible contribution implies the brand is trading volume for price stability in its lead category, and needs either deeper penetration in Flower or re-segmentation within Edible to defend rank and reduce volatility.
Competitive Landscape
Sofa King Tasty is ranked #16 in Arizona Edible for June 2026, down 4 positions year over year from #12, and up 2 places from March 2026’s #18, while still trailing its peak of #10 from July 2024; in contrast, Baked Bros climbed from #4 to #3 with a 30.9% sales increase year over year and Wyld held #1 despite a 15.3% sales decline, indicating Sofa King Tasty’s relative slippage is driven more by rivals’ upward momentum than broad category softness. With Wana moving from #6 to #5 alongside a 10.8% sales lift and OGEEZ steady at #2 with a 15.1% gain, Sofa King Tasty’s 2-rank improvement since March 2026 is incremental against competitors’ faster shifts, implying the brand must convert near-term rank stability into share capture or risk further YoY erosion.

Notable Products
Fruity Pebbles Bar (100mg) posted the steepest decline at -39.5% MoM while dropping to rank 9, and Cookies & Dream Bar (100mg) fell -34.2% at rank 6, signaling a concentrated pullback in confection-style edibles. Sativa Cherry Gummies (100mg) remained rank 1 despite a -15.9% MoM dip, while Sativa Watermelon Gummies (100mg) slid -25.1% at rank 3; five of the top ten are Gummies SKUs, indicating category concentration even amid declines. Skunkee (1g) contracted -32.2% at rank 7, and the larger-format Skunkee (3.5g) entered at rank 10 with $6,677 in June 2026 sales, implying Flower is not offsetting edible softness. Taken together, broad MoM negatives paired with continued gummies dominance suggest Sofa King Tasty is leaning into a narrow edible-led portfolio that may require price-pack or flavor resets rather than mix expansion for June 2026.
Top Selling Cannabis Brands
Data for this report comes from real-time sales reporting by participating cannabis retailers via their point-of-sale systems, which are linked up with Headset’s business intelligence software. Headset’s data is very reliable, as it comes digitally direct from our partner retailers. However, the potential does exist for misreporting in the instance of duplicates, incorrectly classified products, inaccurate entry of products into point-of-sale systems, or even simple human error at the point of purchase. Thus, there is a slight margin of error to consider. Brands listed on this page are ranked in the top twenty within the market and product category by total retail sales volume.

