.svg)

Sep-2026
Sales
Trend
6-Month
Product Count
SKUs
Avg Price
YoY Sales Change
YoY Price Change


Market Insights Snapshot
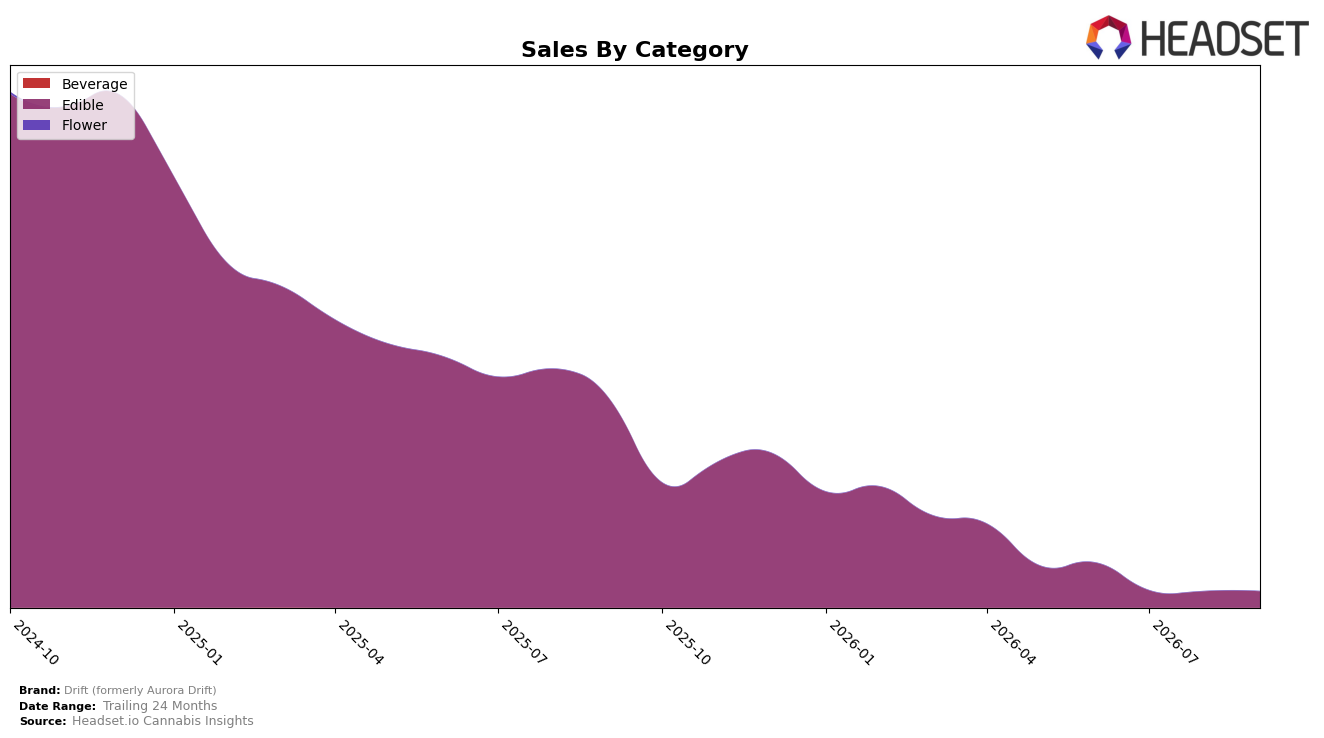
In September 2026, Drift (formerly Aurora Drift) operated as a single-category brand with Edible at 100.0% of mix, while brand sales declined 92.36% year over year and edged down 0.05% month over month; average price fell 16.32% year over year alongside a 0.05% month-over-month sales dip. With no diversification beyond Edible and no stated rank in Alberta Edible, the pattern implies concentration risk: reliance on a lone category while volumes contract 92.36% YoY and pricing compresses 16.32% YoY suggests the brand is trading down-market and ceding breadth of demand.
The shift toward a lower price point at $3.01 amid a 100.0% Edible mix and a null category rank in Alberta Edible indicates repositioning pressure rather than tactical share capture; a 16.32% YoY price cut paired with a 92.36% YoY sales decline points to elasticity limits and potential distribution or SKU rationalization. The near-flat 0.05% MoM sales movement against a fully concentrated mix implies stabilization at a smaller base rather than momentum, meaning September 2026 positioning skews toward value-seeking segments within Edible without cross-category buffering.
Competitive Landscape
Drift (formerly Aurora Drift) ranks #42 in AB Edible in September 2026, down 26 places year over year from #16, and 21 places lower than its June 2026 position of #21; versus a historical peak of #14 in October 2024, this marks a 28-position slide that coincides with competitors consolidating at the top as Spinach holds #1 while posting a -5.43% sales change and Wyld stays at #2 with +32.25% sales growth, and No Future climbs from #5 to #3 on +62.71% sales; the directional gap widens further as Olli moves from #7 to #4 with +88.21% sales and Gron / Grön edges from #3 to #5 with +14.45% sales, implying Drift’s multi-quarter rank decline is not just seasonal volatility but share displacement as faster-growing rivals entrench top-5 positions and compress mid-tier mobility.

Notable Products
Glitches - Pomegranate Berry Chews 10-Pack (100mg) posted the standout move in September 2026 with a +332.8% month-over-month surge to $264 and entered the top tier at rank 4, while Glitch - Berry Cherry Gummy (10mg) slipped -14.0% yet held rank 1. Glitch - Strawberry Lemonade Gummy (10mg) rose +36.8% to rank 2, whereas Glitches - Pomegranate Berry Gummy (10mg) eased -6.4% at rank 3, indicating momentum is concentrated in higher-dosage packs rather than single-serve 10mg formats. Four of the top ten are Edible SKUs from the Glitch/Glitches family, and the split between gains at ranks 2 and 4 and declines at ranks 1 and 3 points to trading up within the same flavor set and pack sizes. The pattern implies Drift (formerly Aurora Drift) is pivoting toward multi-pack, higher-milligram Edibles to drive incremental velocity even as legacy 10mg singles mature.
Top Selling Cannabis Brands






Data for this report comes from real-time sales reporting by participating cannabis retailers via their point-of-sale systems, which are linked up with Headset’s business intelligence software. Headset’s data is very reliable, as it comes digitally direct from our partner retailers. However, the potential does exist for misreporting in the instance of duplicates, incorrectly classified products, inaccurate entry of products into point-of-sale systems, or even simple human error at the point of purchase. Thus, there is a slight margin of error to consider. Brands listed on this page are ranked in the top twenty within the market and product category by total retail sales volume.

