May-2026
Sales
Trend
6-Month
Product Count
SKUs
Avg Price
YoY Sales Change
YoY Price Change
Market Insights Snapshot
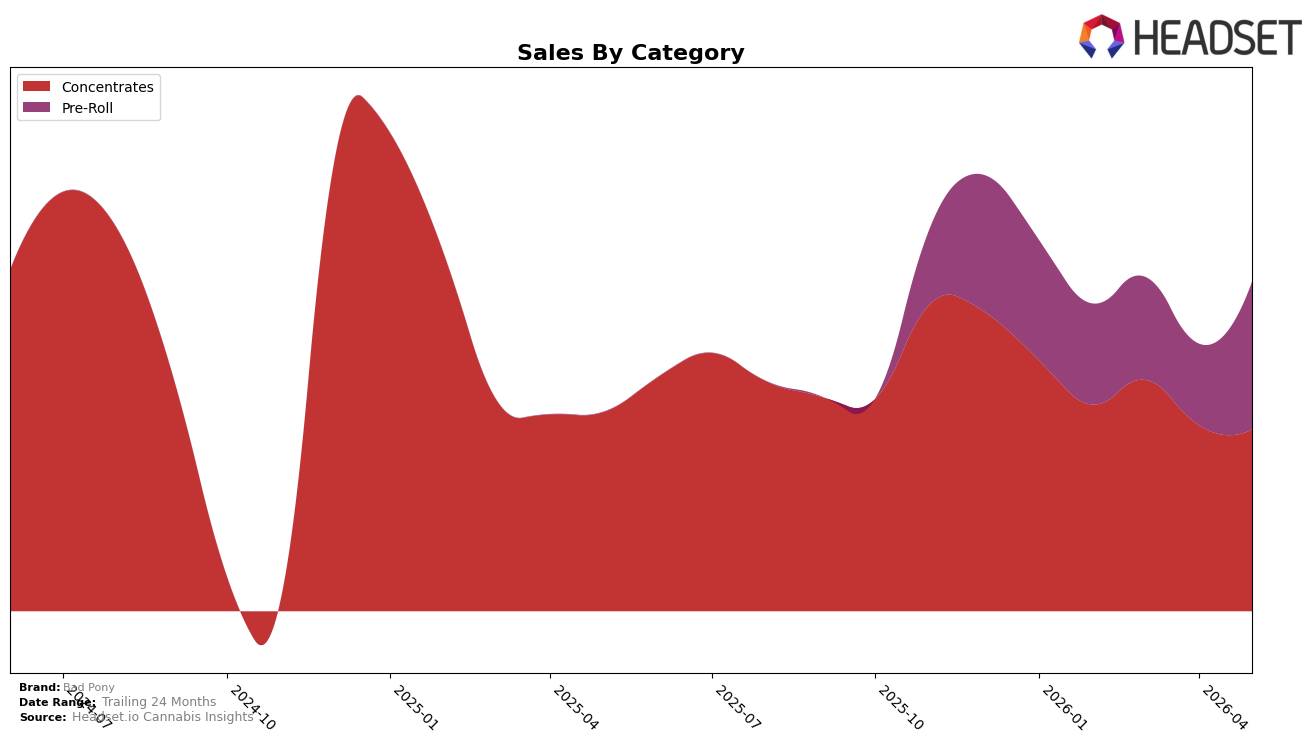
Bad Pony’s category mix in May 2026 skewed to Concentrates at 55.18% share with a year-over-year decline of 8.80% and a month-over-month dip of 2.40%, while Pre-Roll held 44.82% share with an 81.65% month-over-month surge and no reported year-over-year figure; combined, this mix delivered overall brand sales growth of 65.28% year over year alongside a 52.31% drop in average price to $19.02. Within Missouri Concentrates, Bad Pony sat at rank 29 in May 2026, and Concentrates’ average price at $33.58 contrasted with Pre-Roll at $12.40, implying unit mix and pricing shifts are the primary lever behind the brand’s growth despite the Concentrates softness.
The simultaneous 81.65% month-over-month expansion in Pre-Roll against a 2.40% month-over-month pullback in Concentrates, paired with a 52.31% average price decline and a 55.18% vs. 44.82% category split, implies a deliberate pivot toward lower-priced volume to drive share and velocity. Holding rank 29 in Missouri Concentrates while that category’s year-over-year trend is down 8.80% suggests the brand’s near-term positioning relies on Pre-Roll momentum to offset Concentrates headwinds and to stabilize mix as May 2026 growth of 65.28% year over year is powered more by unit gains than by price.
Competitive Landscape
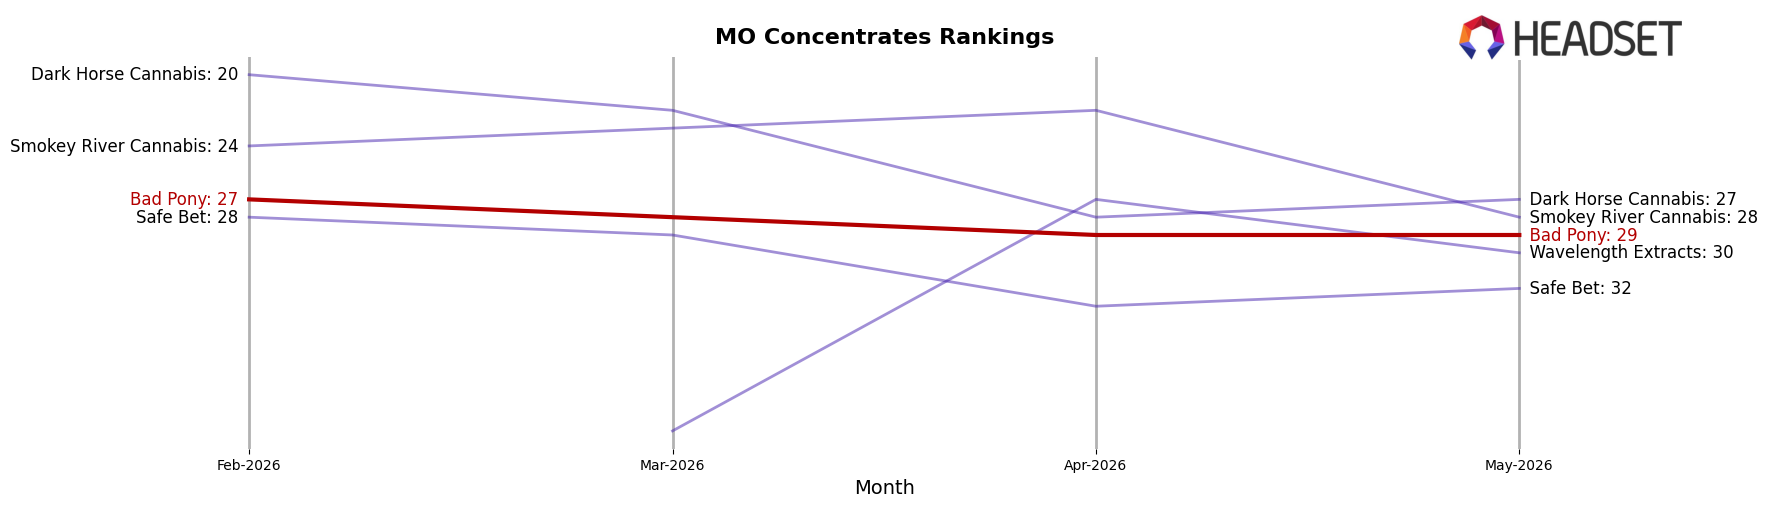
Bad Pony sits at rank 29 in MO Concentrates for May 2026, unchanged year over year at 29 and down 2 places from February 2026’s rank 27, while its peak of rank 17 in December 2024 marks a 12-position slide from that high; in contrast, Vibe Cannabis (MO) held steady at rank 1 year over year and Sinse Cannabis climbed from rank 7 to rank 2, indicating category gains are concentrating at the top as Bad Pony’s flat YoY rank and recent 2-position drift imply entrenchment in the lower tier unless mix or distribution shifts alter trajectory.
Notable Products
Dirty Banana x Puppy Breath Infused Pre-Roll (0.5g) posted the standout move with +136% MoM and jumped to rank 1, while Golden Apple x Rainbow Rozay Infused Pre-Roll (0.5g) followed at +72% MoM and rank 2. Four of the top ten are Pre-Roll SKUs concentrated in infused variants, and Strawberry Cheesecake Live Resin Badder (1g) slipped -8.8% MoM at rank 8 against a Pre-Roll-led surge, with the Dirty Banana family extending into a 5-pack format that reached rank 5 despite no MoM baseline and a single-month take of $8,289. The pattern implies Bad Pony is tilting toward infused Pre-Rolls as the commercial engine, with concentrates acting as secondary volume holders rather than growth drivers.
Top Selling Cannabis Brands
Data for this report comes from real-time sales reporting by participating cannabis retailers via their point-of-sale systems, which are linked up with Headset’s business intelligence software. Headset’s data is very reliable, as it comes digitally direct from our partner retailers. However, the potential does exist for misreporting in the instance of duplicates, incorrectly classified products, inaccurate entry of products into point-of-sale systems, or even simple human error at the point of purchase. Thus, there is a slight margin of error to consider. Brands listed on this page are ranked in the top twenty within the market and product category by total retail sales volume.

