May-2026
Sales
Trend
6-Month
Product Count
SKUs
Avg Price
YoY Sales Change
YoY Price Change
Market Insights Snapshot
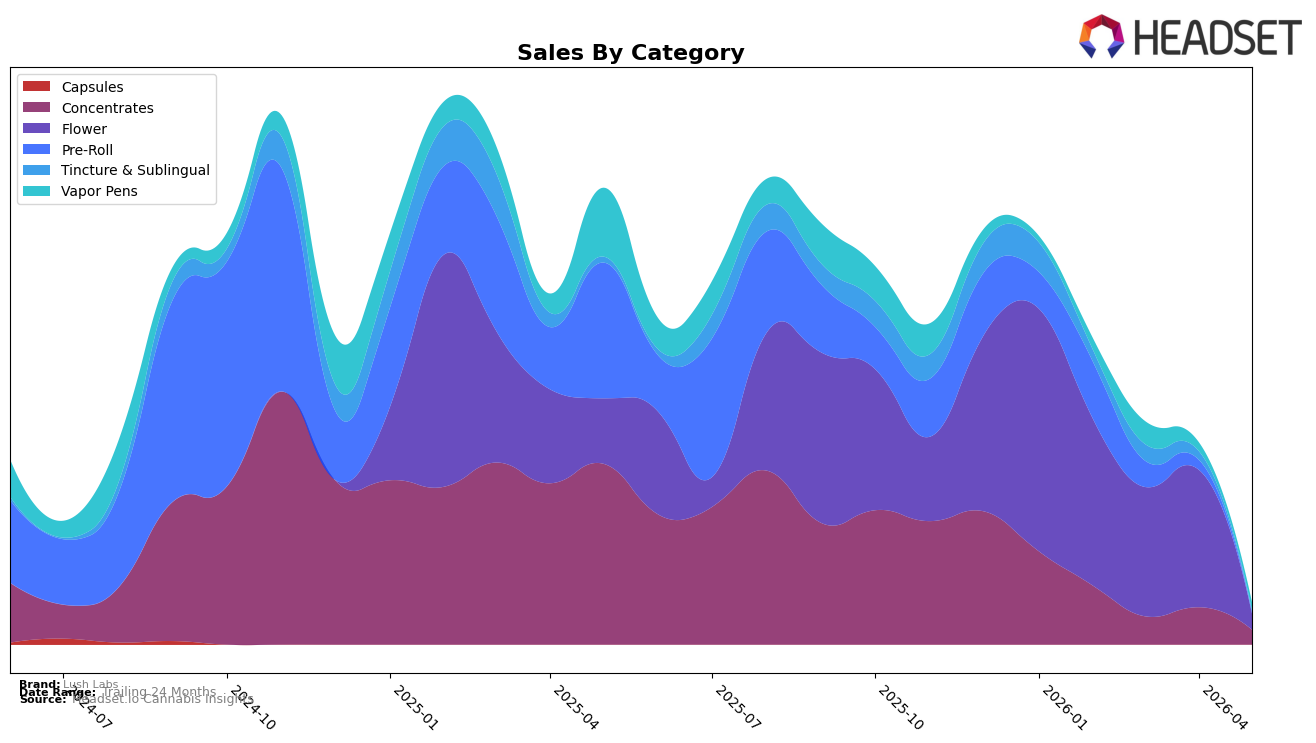
In May 2026, Lush Labs’ mix concentrated in Flower at 38.70% share despite Flower declining 88.38% MoM and 75.54% YoY, while Concentrates held 35.58% share with a 60.56% MoM drop and a 91.88% YoY decline. Vapor Pens rose in mix to 19.59% share as the only category with a comparatively limited MoM contraction of 7.49%, though YoY was down 88.25%; meanwhile, Pre-Roll fell to 3.38% share with an 85.81% MoM and 98.97% YoY decline, and Tincture & Sublingual sat at 2.75% share with 86.60% MoM and 80.24% YoY declines. With average price up 31.01% YoY to $20.54 and category-level volumes falling, the pattern implies Lush Labs is ceding unit velocity in higher-penetration inhalables while maintaining price, pushing the portfolio toward smaller, higher-priced baskets and away from breadth.
The relative stability of Vapor Pens month-over-month at -7.49% versus Flower at -88.38% and Concentrates at -60.56% suggests that pen shoppers remain the brand’s most defensible base, even as overall sales fell 90.96% YoY and 83.38% over 24 months. The mix shift toward a three-category core—Flower 38.70%, Concentrates 35.58%, Vapor Pens 19.59%—paired with a 31.01% YoY average price increase signals a repositioning from volume-led segments (e.g., Pre-Roll at 3.38% share and -98.97% YoY) toward fewer, higher-ticket SKUs; this implies near-term prioritization of margin retention over distribution breadth, with positioning anchored in premium-leaning inhalables rather than value-led formats.
Competitive Landscape
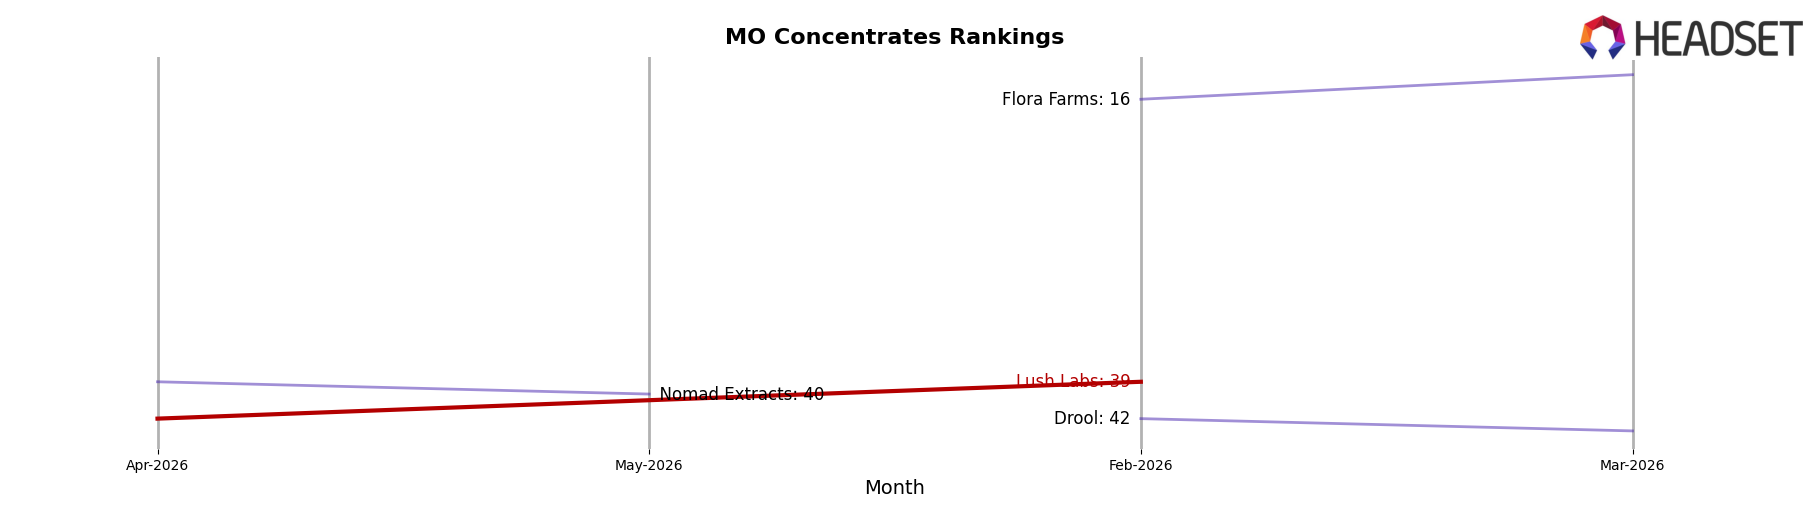
Lush Labs sits at rank #50 in MO Concentrates for May 2026, down 22 positions year over year from #28, and 11 spots lower than its February 2026 mark of #39, while still trailing its peak rank of #24 from November 2024; in directional contrast, Vibe Cannabis (MO) held #1 both this year and last, and Sinse Cannabis improved from #7 to #2 alongside a 30.8% sales YoY gain, whereas Vivid (MO) stayed at #5 with a 25.1% YoY sales decline—taken together, the drop from #28 to #50 and the slide from #39 to #50 across three months indicate Lush Labs is losing share to faster-moving leaders and would need a mix or distribution reset to avoid further down-tiering.
Notable Products
Complex GMO (Bulk) posted the steepest decline at -92.8% MoM while sliding to rank 6 from a higher prior position, and Blue Berry Muffinz (1g) fell -73.5% MoM at rank 5, indicating a sharp reset in legacy Flower velocity. In contrast, Maple Madness (1g) rose +31.3% MoM to secure rank 1, and Pear-fect Storm Distillate Cartridge (1g) dipped -7.5% MoM at rank 2 with $2,273 in May 2026 sales, signaling a shift in spend away from several Flower SKUs even as a single flagship Flower anchors the leaderboard. Three Flower items remain in the top 7 while three Concentrates occupy ranks 8–10, implying mix diversification toward premium extracts alongside consolidation around one high-traction Flower.
Top Selling Cannabis Brands
Data for this report comes from real-time sales reporting by participating cannabis retailers via their point-of-sale systems, which are linked up with Headset’s business intelligence software. Headset’s data is very reliable, as it comes digitally direct from our partner retailers. However, the potential does exist for misreporting in the instance of duplicates, incorrectly classified products, inaccurate entry of products into point-of-sale systems, or even simple human error at the point of purchase. Thus, there is a slight margin of error to consider. Brands listed on this page are ranked in the top twenty within the market and product category by total retail sales volume.

