.svg)

Sep-2026
Sales
Trend
6-Month
Product Count
SKUs
Avg Price
YoY Sales Change
YoY Price Change


Where to Buy
The Standard is stocked at 211 licensed dispensaries across Missouri, Ohio, and 2 other states, 94 of them in Missouri, with the deepest coverage in Kansas City, St. Louis, Columbia, Cape Girardeau, and Springfield. Search by ZIP code or city below to find the closest one, or filter by product type if you are after a specific format.
Market Insights Snapshot
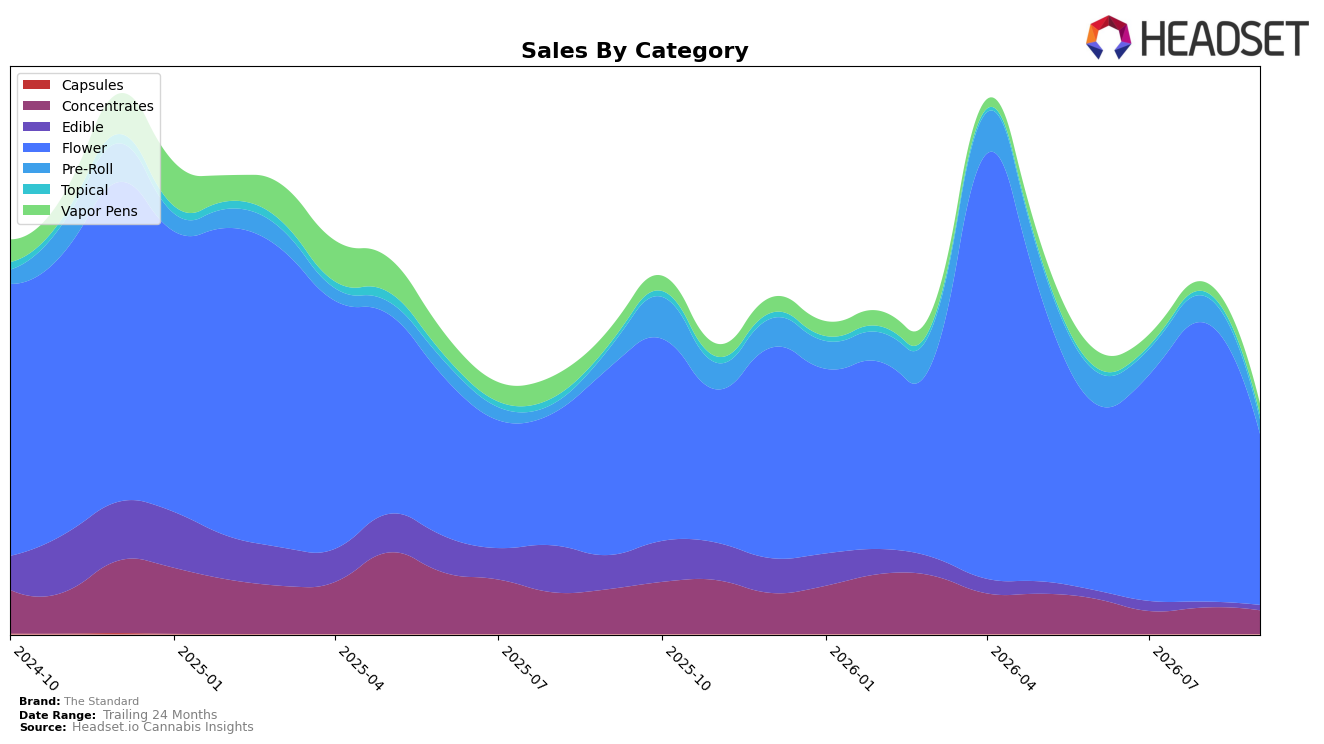
The Standard’s September 2026 mix is dominated by Flower at 74.76% share with a year-over-year decline of 8.36% and a month-over-month drop of 38.75%, while Concentrates hold 10.23% share with a 47.50% YoY decline and a 10.74% MoM decline; Pre-Roll sits at 6.25% share with a 22.39% YoY decline and a 45.57% MoM decline. Countering the broad pullback, Vapor Pens grew 14.93% MoM despite a 28.64% YoY decline and just 4.62% share, and Topical rose 18.14% YoY and 6.43% MoM at 1.95% share, whereas Edible contracted 85.21% YoY and 9.35% MoM at 2.19% share. In Ohio Flower, the brand sits at rank 29, and with brand-level sales down 24.27% YoY alongside a 14.98% YoY rise in average price to $36.71, the pattern implies a price-led mix concentrated in Flower is amplifying volume sensitivity and suppressing recovery in smaller categories.
The steep MoM pullbacks in Flower (-38.75%) and Pre-Roll (-45.57%) alongside Vapor Pens’ 14.93% MoM gain and Topical’s 6.43% MoM lift suggest a pivot opportunity: de-risk from high-volatility Flower while leaning into repeatable, lower-ticket baskets where momentum is positive. With rank 29 in Ohio Flower and a 74.76% reliance on that category, the mix concentration is likely constraining market share progress, while the 85.21% YoY collapse in Edible and 47.50% YoY decline in Concentrates indicate underutilized shelf adjacency where targeted SKU rationalization could redirect demand toward Vapor Pens and Topical; the thesis is that shifting 5–10 percentage points of share from Flower into faster-recovering form factors could stabilize month-over-month variability and mitigate the 24.27% YoY brand contraction.
Competitive Landscape
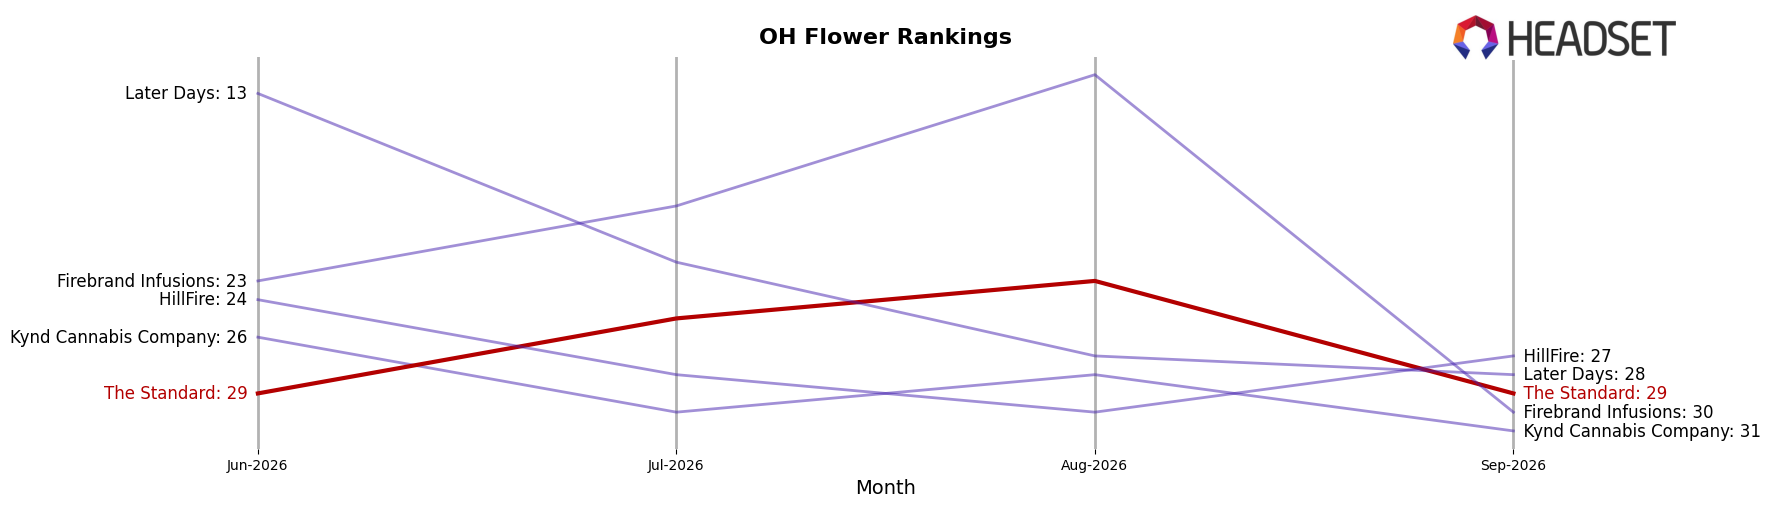
The Standard sits at rank 29 in OH Flower in September 2026, down 5 places from rank 24 year over year, and unchanged versus three months ago at rank 29, while its peak at rank 14 in April 2026 marks a 15-position slide from that high; by contrast, Klutch Cannabis rose from rank 13 to rank 1 alongside a 162.4% year-over-year sales increase, and King City Gardens climbed from rank 10 to rank 2 with 77.4% growth, indicating that The Standard’s flat near-term rank and year-over-year decline signal lost relative velocity as the category consolidates around faster-advancing leaders.
Notable Products
Sugar Fumez (3.5g) posted the steepest movement in September 2026 with a -61.2% month-over-month decline and sat at rank 4, while Dirty Taxi (3.5g) fell -40.5% to rank 3. Strawberry Bomber (3.5g) also contracted -42.2% at rank 8, and Honey Banana (14.15g) held rank 1 despite no reported MoM change, concentrating demand at the top SKU with $69,210 in sales. Four of the top ten SKUs are Flower, and three are Pre-Roll, but the Flower trio’s double-digit declines alongside a stable rank 1 position imply mix risk where a single flagship props up the category while mid-tier Flower softness shifts momentum toward ready-to-smoke formats.
Top Selling Cannabis Brands






Data for this report comes from real-time sales reporting by participating cannabis retailers via their point-of-sale systems, which are linked up with Headset’s business intelligence software. Headset’s data is very reliable, as it comes digitally direct from our partner retailers. However, the potential does exist for misreporting in the instance of duplicates, incorrectly classified products, inaccurate entry of products into point-of-sale systems, or even simple human error at the point of purchase. Thus, there is a slight margin of error to consider. Brands listed on this page are ranked in the top twenty within the market and product category by total retail sales volume.

