Mar-2026
Sales
Trend
6-Month
Product Count
SKUs
Avg Price
YoY Sales Change
YoY Price Change
Market Insights Snapshot
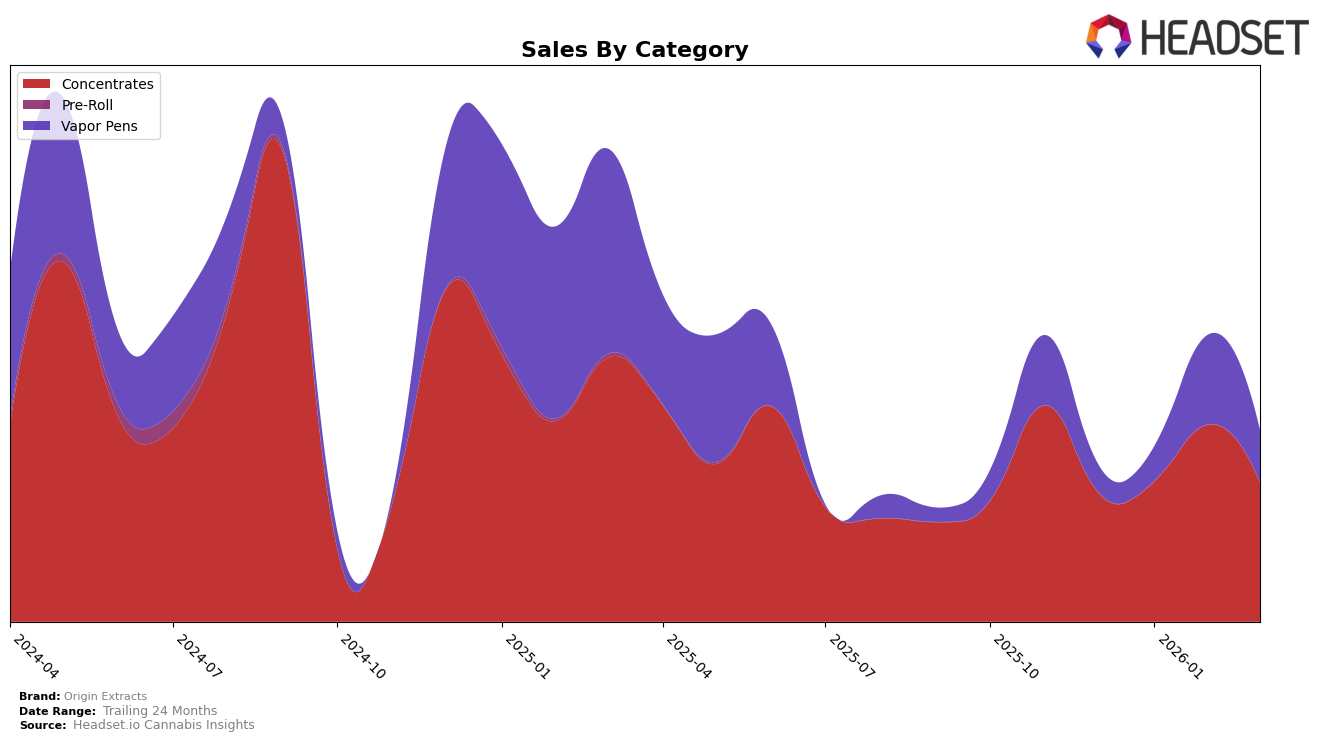
In the state of Missouri, Origin Extracts has shown notable progress in the Concentrates category. Starting from a rank of 34 in December 2025, the brand improved its position to 31 by January 2026, and further climbed to 29 in February before settling at 30 in March. This upward trajectory, despite a slight dip in March, indicates a strengthening presence in the market. The sales figures reflect this growth, with a significant jump from $30,108 in December to $46,363 in February, before slightly decreasing in March. Such movements suggest a competitive edge that Origin Extracts is beginning to carve out in Missouri's Concentrates market.
Conversely, the Vapor Pens category paints a different picture for Origin Extracts in Missouri. The brand did not make it into the top 30 rankings until March 2026, where it debuted at rank 73. This indicates a challenging market landscape for Origin Extracts in this category, highlighting potential areas for strategic improvement. The sales figures for Vapor Pens also reflect this struggle, as they reported $21,193 in February and dropped to $12,284 in March. These numbers underscore the need for targeted efforts to boost their market presence and performance in the Vapor Pens category.
Competitive Landscape
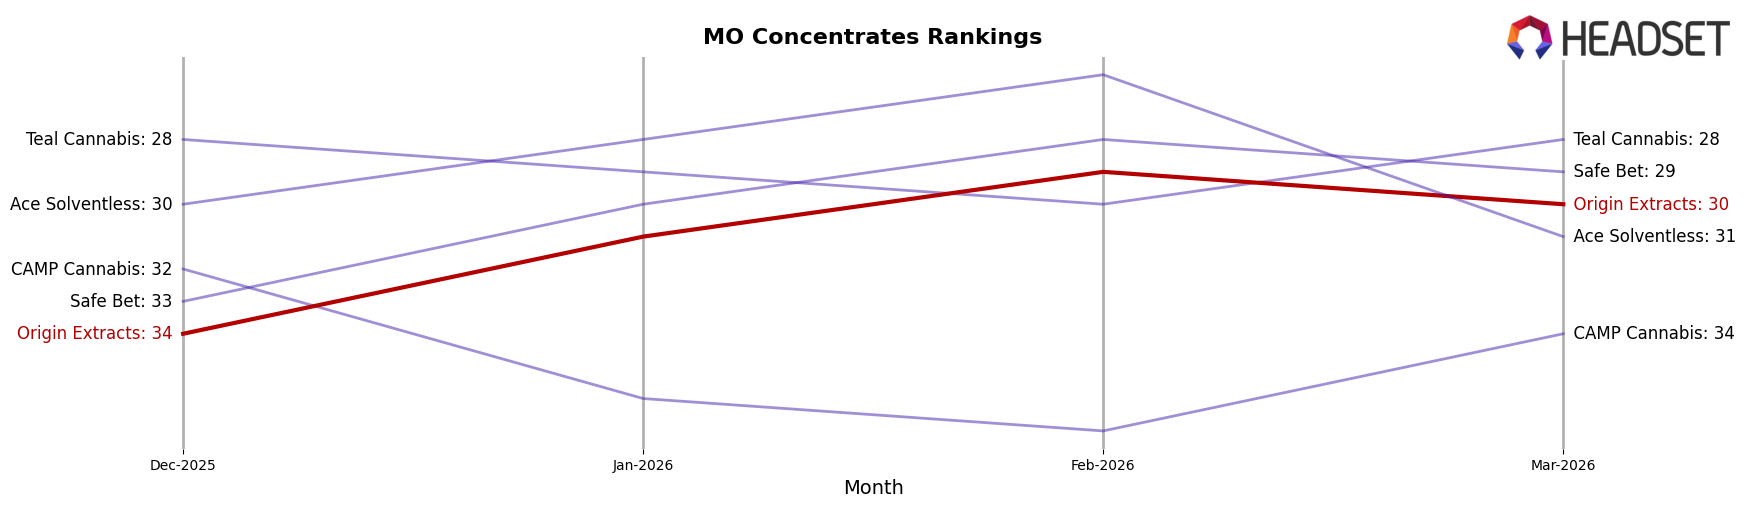
In the Missouri concentrates market, Origin Extracts has shown a dynamic performance with notable fluctuations in rank and sales from December 2025 to March 2026. Starting at rank 34 in December, Origin Extracts improved its position to 31 in January and further to 29 in February, before slightly dropping to 30 in March. This upward trend in the early months indicates a competitive edge, although the slight dip in March suggests potential challenges. In comparison, Safe Bet and CAMP Cannabis maintained lower ranks throughout the period, with Safe Bet showing a consistent upward trajectory, while CAMP Cannabis experienced a decline. Meanwhile, Teal Cannabis and Ace Solventless have been more volatile, with Ace Solventless dropping to 31 in March after peaking at 26 in February. Despite these fluctuations, Origin Extracts' sales performance in February was particularly strong, surpassing both Safe Bet and CAMP Cannabis, although it remained below Teal Cannabis and Ace Solventless. This suggests that while Origin Extracts is gaining traction, it faces stiff competition from brands with more stable or higher sales figures.
Notable Products
In March 2026, Tallymon Cured Shatter (1g) from Origin Extracts maintained its top position as the best-selling product, continuing its success from February with impressive sales of 716 units. Notably, Donny Burger Live Resin Crumble (1g) emerged as the second-best performer, marking its debut in the rankings with a strong entry. DW Smuggler Cured Shatter (1g) secured the third spot, showing a consistent presence since its introduction. Bomb Pop Liquid Live Resin Cartridge (1g) and Red Rocket Distillate Cartridge (1g) rounded out the top five, ranking fourth and fifth respectively. This month saw a shift in the Vapor Pens category, with these products entering the top ranks for the first time.
Top Selling Cannabis Brands
Data for this report comes from real-time sales reporting by participating cannabis retailers via their point-of-sale systems, which are linked up with Headset’s business intelligence software. Headset’s data is very reliable, as it comes digitally direct from our partner retailers. However, the potential does exist for misreporting in the instance of duplicates, incorrectly classified products, inaccurate entry of products into point-of-sale systems, or even simple human error at the point of purchase. Thus, there is a slight margin of error to consider. Brands listed on this page are ranked in the top twenty within the market and product category by total retail sales volume.

