Market Insights Snapshot
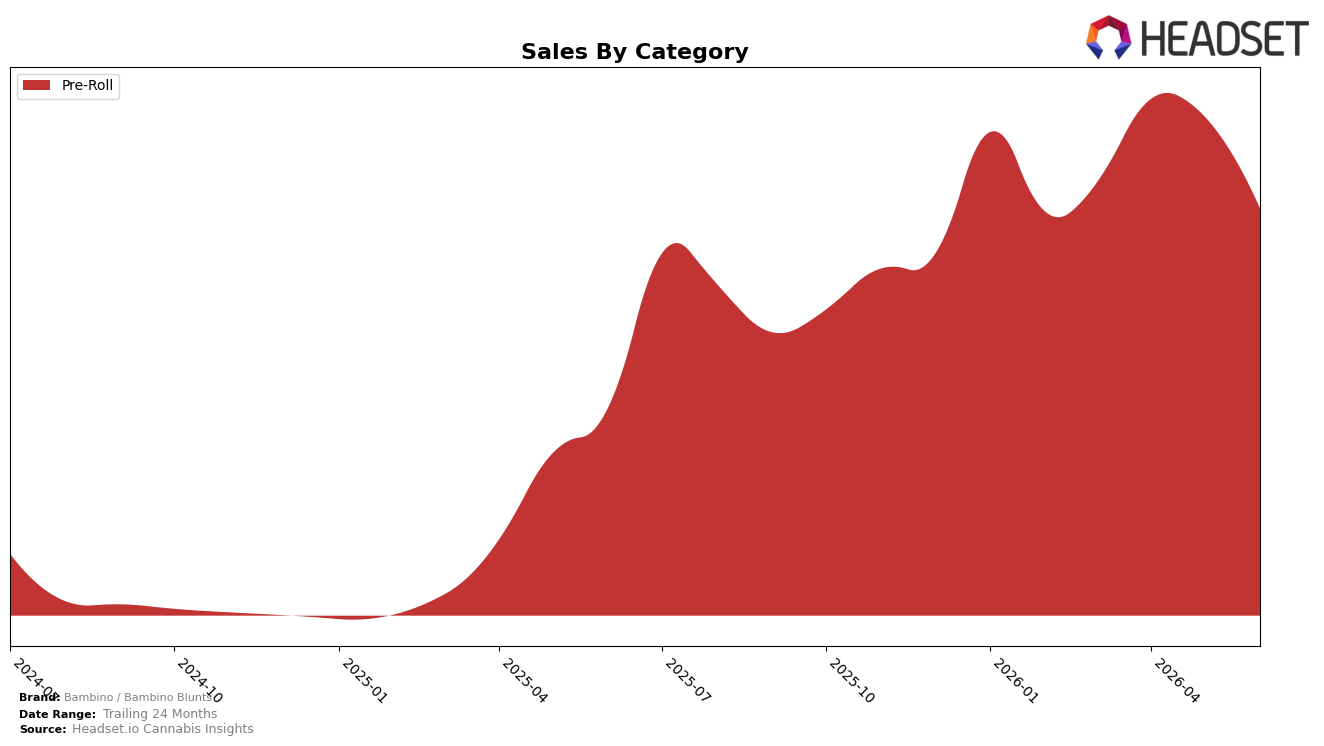
In June 2026, Bambino / Bambino Blunts operated as a single-category brand with Pre-Roll at 100.0% of mix and an average price of $25.01, while year-over-year sales rose 95.4% and month-over-month sales fell 18.4%. The brand’s Pre-Roll concentration aligns with a rank of 23 in Pre-Roll within Missouri, and pricing decreased 4.3% year over year alongside the MoM contraction of 18.4%, implying volume gains YoY but a June pullback MoM within the same category position.
The combination of a 100.0% Pre-Roll mix and a 4.3% YoY price decline suggests Bambino / Bambino Blunts leaned on price efficiency to fuel a 95.4% YoY sales increase, yet the 18.4% MoM decline in June 2026 indicates sensitivity to short-cycle demand or promotional cadence at rank 23. Taken together, the brand’s single-category exposure and mid-20s rank point to a positioning reliant on Pre-Roll depth rather than portfolio breadth, where sustaining share likely depends on maintaining sub-$26 price points and converting YoY volume momentum into steadier month-to-month performance.
Competitive Landscape
Bambino / Bambino Blunts sits at rank #23 in Missouri Pre-Roll for June 2026, improving 10 positions from #33 year over year, while holding flat versus March 2026 at #23; its peak of #18 in January 2026 marks a 5-rank slide from that high. In directional context, Jeeter holds #1, Illicit / Illicit Gardens remains at #2 with a 44.6% YoY sales increase, and Sinse Cannabis climbed from #7 to #3 on 178.0% YoY growth, whereas Good Day Farm sits at #4 with a 39.5% YoY sales decline; this mix of upward and downward competitor movements indicates that Bambino / Bambino Blunts’ 10-rank YoY ascent amid a flat recent quarter points to stabilization after a January pullback, implying its trajectory depends on converting mid-20s rank consistency into a return toward the #18 peak rather than ceding ground to faster risers.

Notable Products
Sugar Cookie Infused Blunt (2g) posted the largest movement in June 2026 with a +97% month-over-month surge to rank 3, while Game Over Moonrock Infused Blunt (1g) fell -15% yet held rank 1, indicating share is consolidating toward upsized formats even as the flagship cools. Coffee Creamer Moonrock Infused Blunt (1g) collapsed -82% to rank 10, and Moonbow Moonrock Infused Blunt (1g) dropped -39% to rank 2, a divergence that implies 1g moonrock variants are ceding velocity to heavier weights. With all top-10 SKUs in Pre-Roll and at least three 2g offerings landing in ranks 3, 5, and 6 alongside +97% and +67% gains, the mix is tilting toward larger, value-forward units. The pattern implies Bambino / Bambino Blunts is pivoting from novelty 1g moonrock propositions to scaled 2g formats to defend rank position and stabilize month-to-month variability.
Top Selling Cannabis Brands
Data for this report comes from real-time sales reporting by participating cannabis retailers via their point-of-sale systems, which are linked up with Headset’s business intelligence software. Headset’s data is very reliable, as it comes digitally direct from our partner retailers. However, the potential does exist for misreporting in the instance of duplicates, incorrectly classified products, inaccurate entry of products into point-of-sale systems, or even simple human error at the point of purchase. Thus, there is a slight margin of error to consider. Brands listed on this page are ranked in the top twenty within the market and product category by total retail sales volume.

