Jun-2026
Sales
Trend
6-Month
Product Count
SKUs
Avg Price
YoY Sales Change
YoY Price Change
Market Insights Snapshot
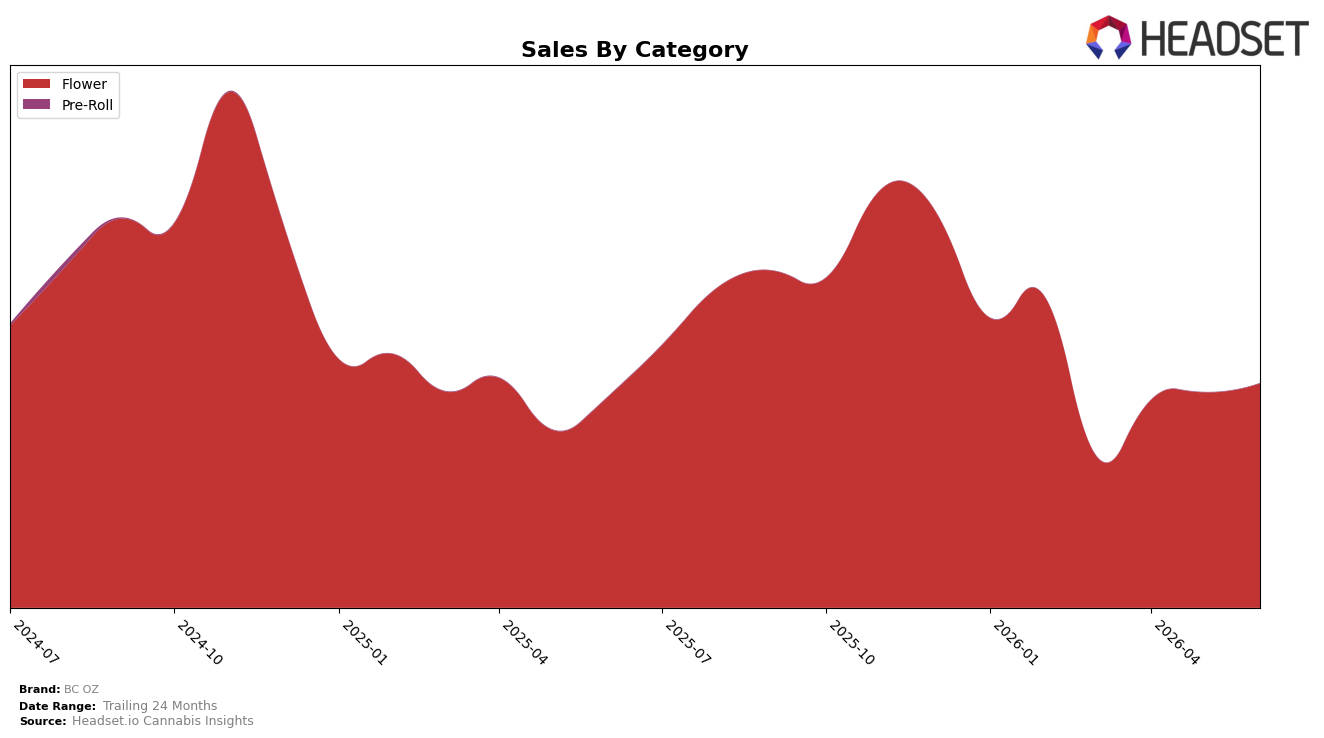
In June 2026, BC OZ concentrated 100.0% of sales in Flower, with category sales up 6.37% year over year and 4.18% month over month, while brand-level sales rose 6.19% YoY and pricing inched up 0.93% YoY to $126.87. Within British Columbia Flower, BC OZ held rank 11, and the single-category focus, coupled with a MoM lift of 4.18% against a YoY price increase of 0.93%, indicates unit growth outpacing price and a tactical tilt toward volume within Flower.
The 24‑month sales change of −34.30% alongside a current rank of 11 and a June 2026 MoM gain of 4.18% implies BC OZ is stabilizing within Flower but remains dependent on a single demand pool, leaving headroom if rank can improve by low single digits. With 100.0% category concentration and only a 0.93% YoY price move, the pattern points to a volume-led positioning in British Columbia Flower where share gains will hinge on sustaining mid-single‑digit monthly sell-through improvements or adding adjacent categories to diversify exposure.
Competitive Landscape
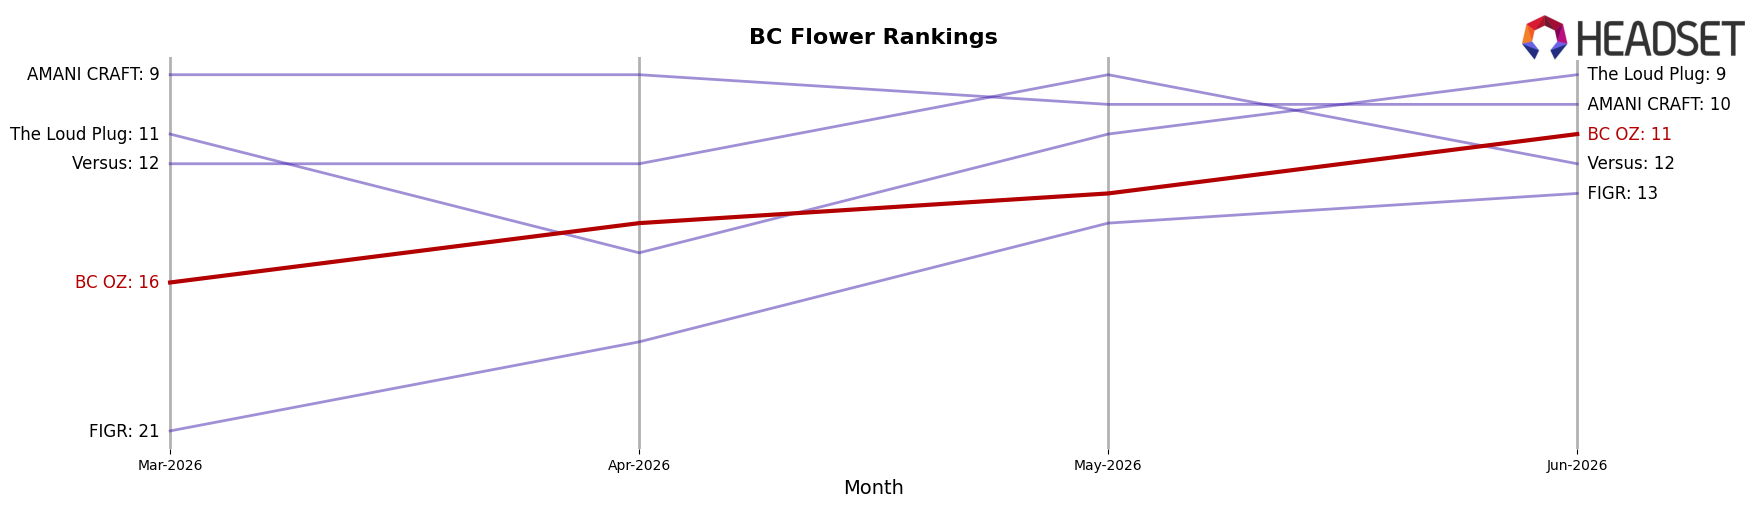
BC OZ sits at rank #11 in BC Flower in June 2026, a 4-place improvement from #15 year over year and a 5-place climb from #16 three months ago, while still far from its peak at #1 in October 2025; in the same period, Good Supply advanced from #6 to #1 with 78.1% YoY sales growth and Spinach moved from #8 to #3 with 84.9% YoY growth, whereas Bake Sale edged down from #3 to #5 alongside an 8.2% YoY sales decline, and The Original Fraser Valley Weed Co. slipped from #1 to #4 with a 24.4% YoY decline; the pattern implies BC OZ’s rank recovery is incremental and dependent on sustaining momentum against faster-rising leaders.
Notable Products
Comfortably Numb (28g) delivers the headline move in June 2026 with a +230% month-over-month surge into rank 2, while 9 lb Hammer (28g) falls -22% yet holds rank 3, implying mix shift rather than a category exit. Power Nap (28g) drops -63% to rank 5 and Code Red (28g) declines -56% at rank 9, whereas Ghost OG (28g) is nearly flat at -0.6% in rank 4, signaling stabilization among mid-pack SKUs. Eight of the top ten are Flower SKUs, and Lemon Heads (28g) retains rank 1 with $158,415 despite no posted MoM figure, indicating that outsized gains are consolidating around a narrow set of high-volume ounces while weaker Flower variants retrench.
Top Selling Cannabis Brands
Data for this report comes from real-time sales reporting by participating cannabis retailers via their point-of-sale systems, which are linked up with Headset’s business intelligence software. Headset’s data is very reliable, as it comes digitally direct from our partner retailers. However, the potential does exist for misreporting in the instance of duplicates, incorrectly classified products, inaccurate entry of products into point-of-sale systems, or even simple human error at the point of purchase. Thus, there is a slight margin of error to consider. Brands listed on this page are ranked in the top twenty within the market and product category by total retail sales volume.

