Jun-2026
Sales
Trend
6-Month
Product Count
SKUs
Avg Price
YoY Sales Change
YoY Price Change
Market Insights Snapshot
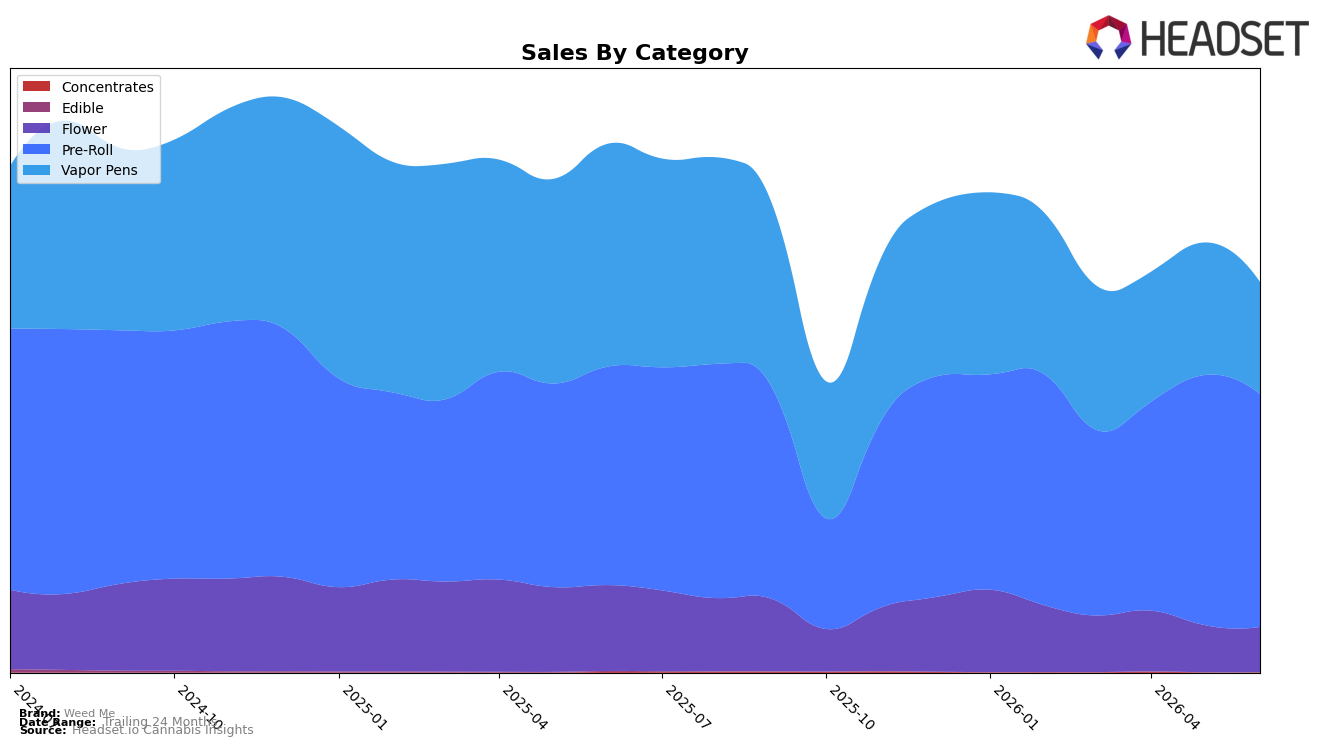
Weed Me concentrated nearly three-fifths of June 2026 sales in Pre-Roll, with a 59.70% mix that grew 6.58% year over year but slipped 6.86% month over month, while Vapor Pens fell 49.76% YoY and 15.45% MoM to 28.71% share. Flower contracted 47.59% YoY and 4.18% MoM to 11.52% share, and Concentrates, despite a 53.10% MoM uptick, remain just 0.07% of sales after a 58.05% YoY drop; Edible collapsed 99.34% YoY to 0.00% share. With average price down 21.80% YoY and total brand sales down 26.19% YoY, the pattern implies Weed Me is relying on Pre-Roll resilience and price compression to offset steep declines in Vapor Pens and Flower.
Holding the number 2 rank in Pre-Roll within British Columbia while Pre-Roll mix sits at 59.70% suggests Weed Me is over-indexed in a category where it retains relative standing, even as a 6.86% MoM pullback hints at short-term share risk. The simultaneous 49.76% YoY decline in Vapor Pens and 47.59% YoY decline in Flower signal a weakening multi-category footprint, implying that June 2026 momentum depends on defending Pre-Roll rank 2 and selectively rebuilding secondary categories rather than chasing breadth amid a 21.80% YoY price decline.
Competitive Landscape
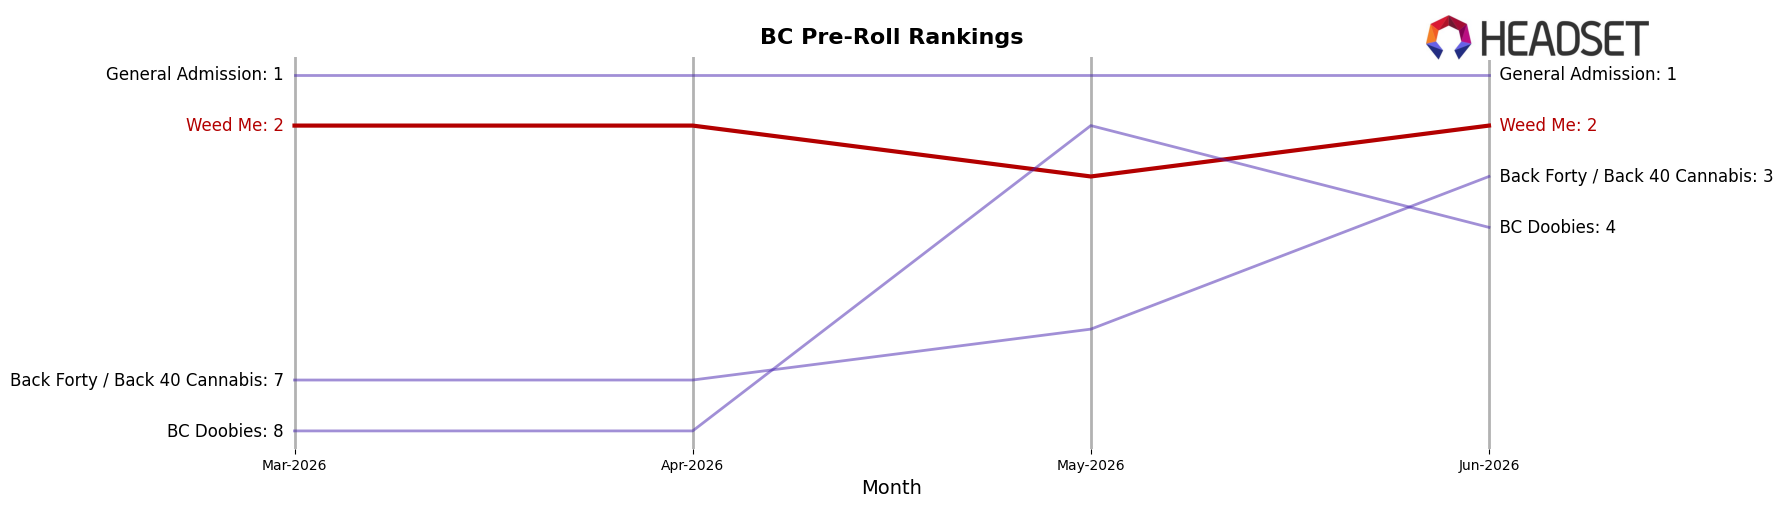
Weed Me sits at rank #2 in BC Pre-Roll in June 2026, improving 1 place year over year from #3, and matching its three-month position at #2, while also matching its peak rank at #2 in June 2026; meanwhile, General Admission holds #1 but is down 18.9% year over year in sales, and Back Forty / Back 40 Cannabis climbed from #22 to #3 with a 263.3% sales increase. Against this backdrop, Weed Me’s stable #2 and one-place YoY climb, alongside a weakening #1 and a rapidly advancing #3, implies the path to #1 is opening but the window could narrow if the #3 momentum persists.
Notable Products
Max- Mango Blueberry Slush Liquid Diamond Cartridge (1g) posted the steepest decline in June 2026 at -19.7% MoM while sliding to rank 4, whereas Blue Iguana Pre-Roll 3-Pack (1.5g) climbed 39.7% MoM at rank 2, and Black Mountain Side Pre-Roll 3-Pack (1.5g) advanced 20.7% MoM to hold rank 1. Pre-Rolls occupy 8 of the top 10 slots, with ranks 1, 2, 3, 5, 6, 7, 8, and 10, while Vapor Pens sit at ranks 4 and 9 with -19.7% and -9.3% MoM respectively. The mix signals Weed Me’s momentum is consolidating in multi-pack Pre-Rolls, while the decline in Liquid Diamond cartridges suggests near-term reallocations away from Vapor Pens despite a single SKU still producing $373,933.
Top Selling Cannabis Brands
Data for this report comes from real-time sales reporting by participating cannabis retailers via their point-of-sale systems, which are linked up with Headset’s business intelligence software. Headset’s data is very reliable, as it comes digitally direct from our partner retailers. However, the potential does exist for misreporting in the instance of duplicates, incorrectly classified products, inaccurate entry of products into point-of-sale systems, or even simple human error at the point of purchase. Thus, there is a slight margin of error to consider. Brands listed on this page are ranked in the top twenty within the market and product category by total retail sales volume.

