Jun-2026
Sales
Trend
6-Month
Product Count
SKUs
Avg Price
YoY Sales Change
YoY Price Change
Market Insights Snapshot
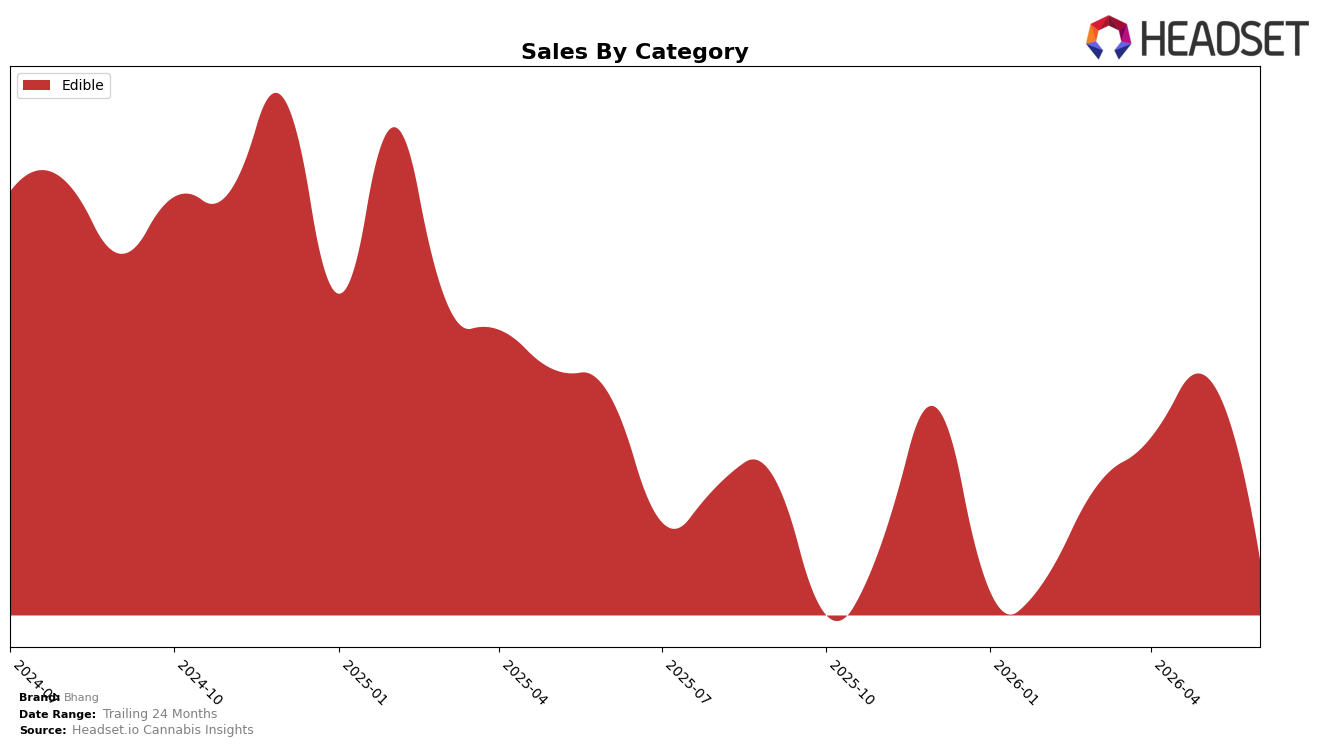
In June 2026, Bhang’s mix is fully concentrated in Edible at 100.0% share, with category sales down 15.1% year over year and 16.4% month over month, while average price declined 0.8% YoY within the same period. The Edible rank in British Columbia sits at 13, indicating mid-pack placement as volume contracts faster MoM than YoY, and average price moves minimally versus unit velocity. The pattern implies Bhang is leaning entirely on Edible exposure during a demand downswing, where a 16.4% MoM contraction alongside a 0.8% YoY price dip suggests volume-led pressure rather than price-led erosion.
With 100.0% of sales tied to Edible and a June 2026 provincial rank of 13, Bhang’s positioning centers on scale within a single format rather than breadth, and the 15.1% YoY decline paired with a steeper 16.4% MoM pullback signals current-period drag exceeding the annual trend. Given the average price only moved 0.8% lower YoY while total brand sales fell 15.1% YoY, the shift implies limited pricing leverage and a need for mix or pack architecture adjustments inside Edible rather than cross-category diversification near term.
Competitive Landscape
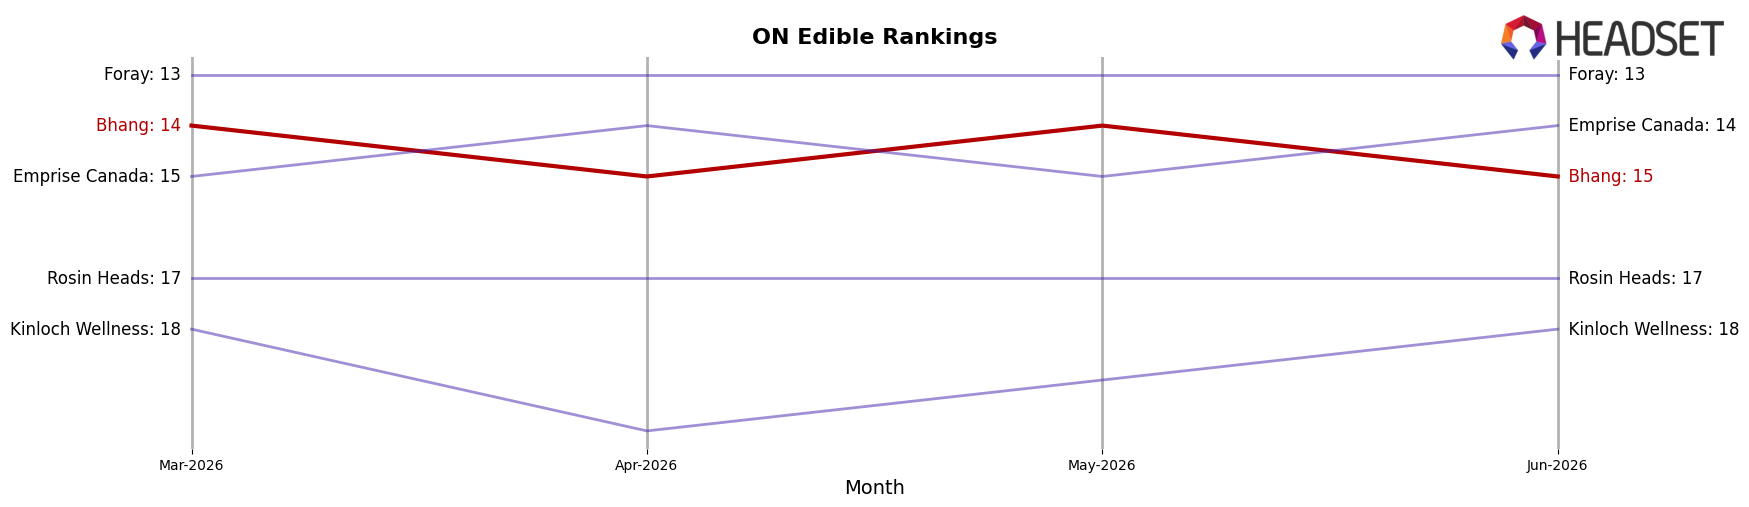
Bhang ranks #15 in ON Edible in June 2026, down 5 positions year over year from #10, and 1 position below its March 2026 level of #14, while its peak of #10 in July 2025 underscores a multi-quarter slide; meanwhile, Spinach held #1 with a 9.9% YoY sales increase and Wyld advanced from #4 to #3 with 21.9% YoY growth, indicating Bhang is losing rank share as faster-growing leaders consolidate the top tier; with Olli climbing from #7 to #4 on 120.7% YoY growth and No Future steady at #5 with 47.3% YoY growth, the pattern implies Bhang’s downward rank trajectory reflects relative underperformance versus accelerating competitors and suggests further erosion unless its velocity improves.
Notable Products
THC Candy Cane White Chocolate Bar (10mg) posted the largest movement in June 2026 with +192.3% month over month to rank 10, while Ice Milk Chocolate Bar (10mg) followed at +106.6% MoM at rank 9; by contrast, THC Milk Chocolate Bar 4-Pack (10mg) fell -28.1% MoM to rank 2 and Cookies and Cream White Chocolate Bar (10mg) dropped -31.6% MoM to rank 4. THC Dark Chocolate Bar 4-Pack (10mg) held rank 1 with a +3.5% MoM lift, but five SKUs from ranks 2–6 declined between -9.7% and -31.6%, indicating a bifurcation between niche seasonal or novelty SKUs gaining share and core multi-pack and flavor staples losing momentum. With all top-10 items in Edible chocolate and the top two ranks occupied by 4-Packs, the mix points to a portfolio skewed to chocolate formats that may be overexposed to flavor fatigue at the core while opportunistic limited flavors drive incremental spikes, implying Bhang should lean into rotational innovations without eroding flagship consistency.
Top Selling Cannabis Brands
Data for this report comes from real-time sales reporting by participating cannabis retailers via their point-of-sale systems, which are linked up with Headset’s business intelligence software. Headset’s data is very reliable, as it comes digitally direct from our partner retailers. However, the potential does exist for misreporting in the instance of duplicates, incorrectly classified products, inaccurate entry of products into point-of-sale systems, or even simple human error at the point of purchase. Thus, there is a slight margin of error to consider. Brands listed on this page are ranked in the top twenty within the market and product category by total retail sales volume.

