.svg)
Sep-2026
Sales
Trend
6-Month
Product Count
SKUs
Avg Price
YoY Sales Change
YoY Price Change


Market Insights Snapshot
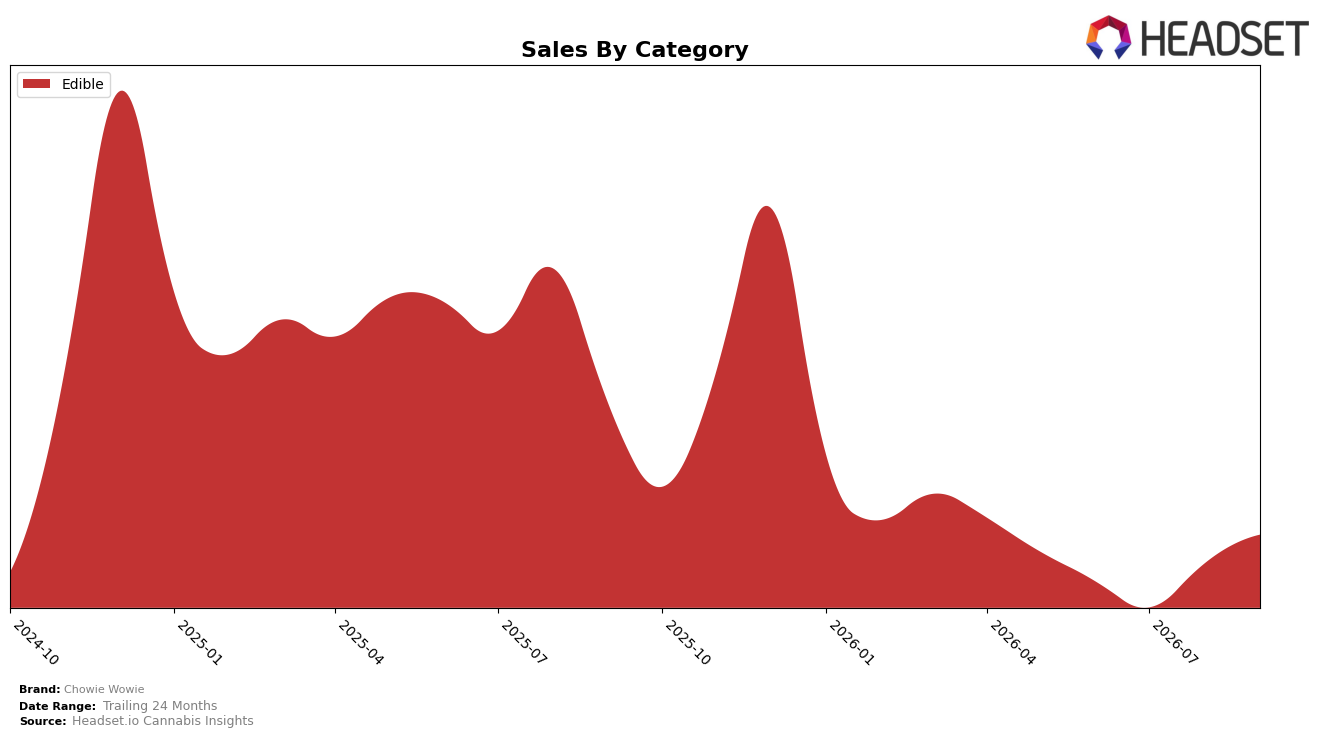
In September 2026, Chowie Wowie operated as a single-category brand with Edible at 100.0% of sales mix, while Edible sales declined 11.6% year over year and rose 3.0% month over month. The brand’s average price increased 19.4% year over year alongside a category rank of 7 in Edible for Saskatchewan, indicating volume pressure despite a modest monthly uptick. The pattern implies a price-led strategy within Edible that lifted short-term momentum (up 3.0% MoM) but compressed annual performance (down 11.6% YoY), positioning the brand to trade mix within formats rather than diversify categories.
The combination of a 100.0% reliance on Edible and a 19.4% YoY price increase suggests a move up-price that likely lowered units enough to drive the 11.6% YoY sales contraction, even as September 2026 stabilized with a 3.0% MoM gain. Holding the number 7 rank in Edible in Saskatchewan while elevating pricing implies a mid-pack positioning that depends on price realization rather than share expansion, meaning future share gains will require either moderating price or adding breadth beyond a single-category footprint.
Competitive Landscape
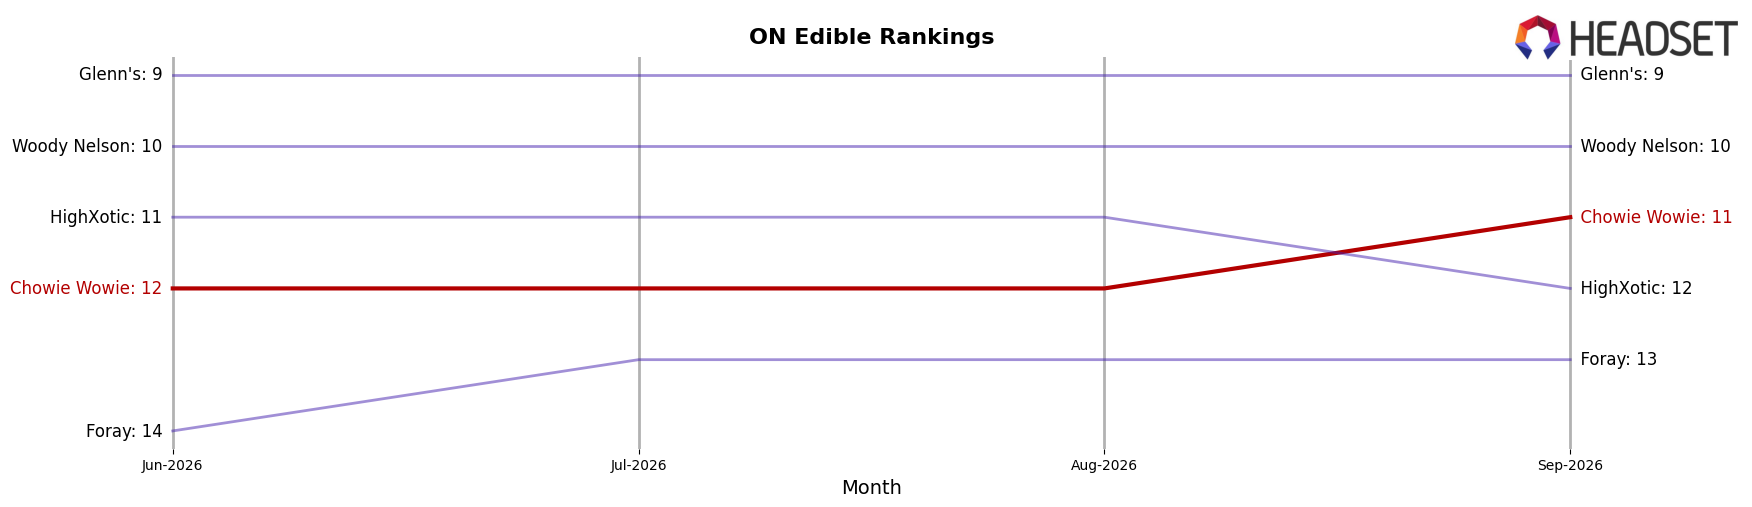
Chowie Wowie sits at rank #11 in ON Edible in September 2026, down 2 positions year over year from #9, and up 1 position versus three months ago from #12; compared with a prior peak of #8 in June 2025, the current #11 indicates a 3-rank gap to its historical best. Competitors are moving in the opposite direction: Olli climbed from #5 to #3 with a 46.97% year-over-year sales increase, while No Future advanced from #6 to #4 alongside 45.56% growth; at the top, Spinach held #1 year over year with 7.30% growth, and Wyld slipped from #4 to #5 despite 17.81% growth. The pattern implies that Chowie Wowie’s two-position year-over-year rank decline, coupled with faster-rising mid-pack rivals gaining 1–2 ranks, points to share being reallocated toward brands with sharper momentum unless Chowie Wowie alters its trajectory.
Notable Products
Chowie Wowie’s CBD/THC 1:1 Peanut Butter Chocolate 2-Pack (10mg CBD, 10mg THC) posted the steepest decline in September 2026 at -22.5% MoM while sitting at rank 7, contrasting with the CBD/THC 1:1 Peanut Butter Balanced Milk Chocolate (10mg CBD, 10mg THC) up 38.3% MoM at rank 2. The CBD/THC 1:1 Solid Milk Chocolate Bar 2-Pack (10mg CBD, 10mg THC) remained at rank 1 despite a -106.4% MoM swing against approximately $91,468 in sales, and the CBD/THC 1:1 Milk Chocolate 4-Pack (40mg CBD, 40mg THC) dipped -8.7% MoM at rank 5. With all top-ten SKUs concentrated in Edible chocolate formats and mixed single-serve versus multi-pack outcomes, the pattern implies a pivot toward single-bar 1:1 novelty flavors driving near-term trials while multi-pack 1:1 formats face elasticity pressure.
Top Selling Cannabis Brands






Data for this report comes from real-time sales reporting by participating cannabis retailers via their point-of-sale systems, which are linked up with Headset’s business intelligence software. Headset’s data is very reliable, as it comes digitally direct from our partner retailers. However, the potential does exist for misreporting in the instance of duplicates, incorrectly classified products, inaccurate entry of products into point-of-sale systems, or even simple human error at the point of purchase. Thus, there is a slight margin of error to consider. Brands listed on this page are ranked in the top twenty within the market and product category by total retail sales volume.

