Jun-2026
Sales
Trend
6-Month
Product Count
SKUs
Avg Price
YoY Sales Change
YoY Price Change
Market Insights Snapshot
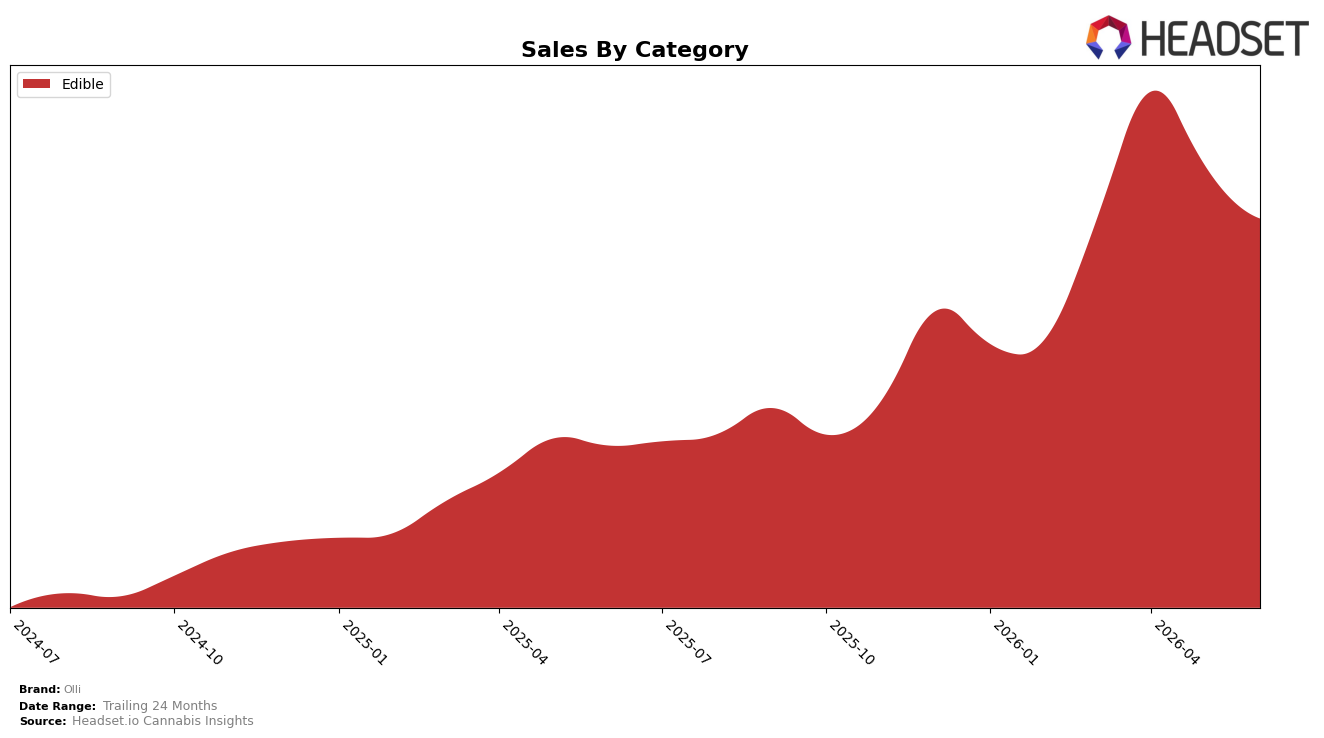
In June 2026, Olli’s mix was concentrated entirely in Edible at 100.0% share, with category sales up 101.4% year over year but down 10.6% month over month; the average price rose 112.1% YoY to $8.80 while unit-driven momentum cooled MoM alongside the negative 10.6% swing. The combination of a triple‑digit YoY sales increase and a sole‑category concentration implies Olli is scaling depth within Edible rather than breadth, using price-led gains to offset short-term volume softness, which positions the brand to defend its Edible focus even as intra-month demand moderates.
Ranked 3 in Edible in Alberta, Olli’s 101.4% YoY sales growth alongside a 112.1% YoY price increase and a 10.6% MoM sales decline suggests a premium-leaning stance that trades higher prices for share stability within Edible. With 100.0% of sales in one category and a top-state footprint centered on ON, the pattern implies Olli’s positioning is anchored in a single-category, price-elastic strategy where maintaining a top-3 provincial rank hinges on sustaining price acceptance while mitigating MoM volatility through pack architecture or promotional cadence.
Competitive Landscape
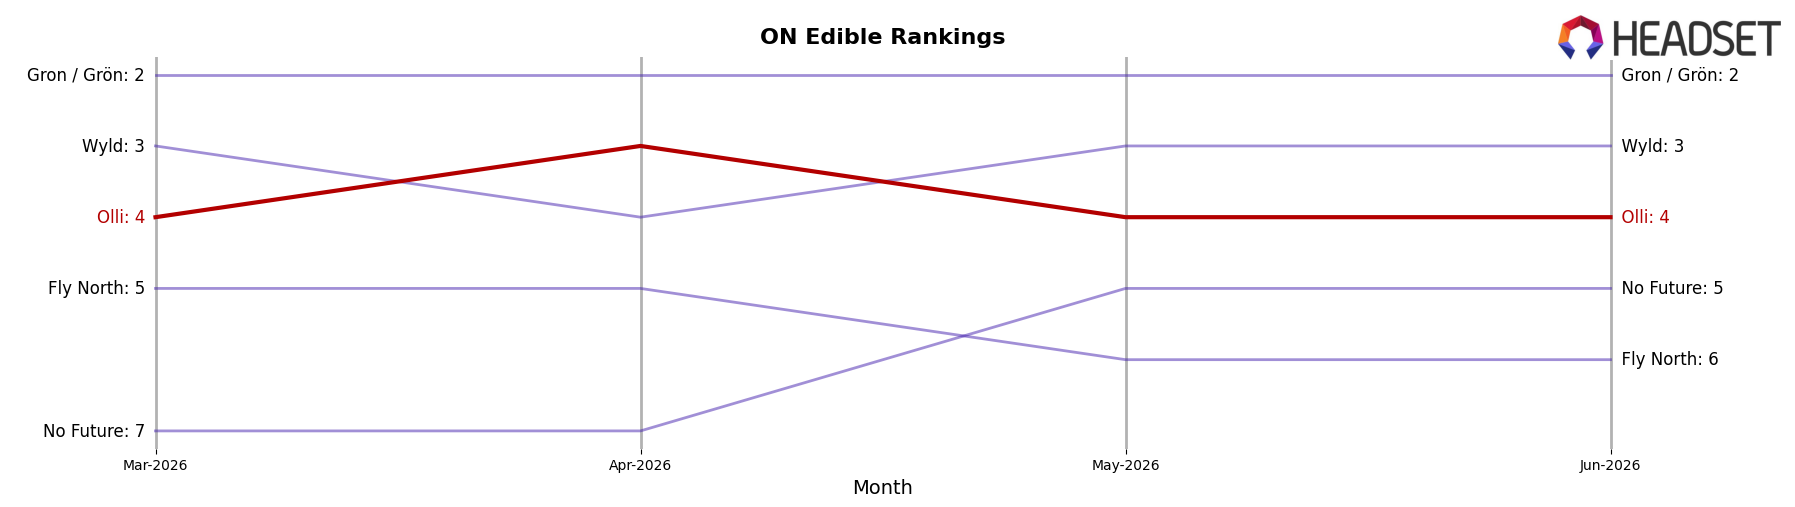
Olli sits at rank #4 in ON Edible for June 2026, improving 3 positions from #7 year over year, while holding steady at #4 versus three months ago and coming off a peak of #3 in April 2026; in contrast, Wyld climbed from #4 to #3 with a 21.9% YoY sales gain and Spinach held #1 year over year with 9.9% YoY growth, indicating Olli’s upward rank mobility is real but presently capped by faster-moving incumbents at the top.
Notable Products
Stikistix - Grandaddy Blackberry Live Rosin Chews 10-Pack (100mg) posted the steepest decline at -15.23% while slipping to rank 8, and the category leader Stikistix - CBG/THC 3:1 Razzy Pink Lemonade Soft Chew 4-Pack (30mg CBG, 10mg THC) fell -14.09% at rank 1; together with Sour Blue Raspberry Chews 10-Pack (100mg) at -13.77% and rank 10, the downside clustered in the branded gummy tier implies price or promo pressure at the top of the chart. Across the top ten, eight of ten SKUs are Stikistix/ StikiStix-branded gummies and nine of ten are Edibles, yet the only MoM gain came from Sour Blueberry Blue Dream Rosin Gummies 10-Pack (100mg) at +17.87% and rank 7, contrasting with the double-digit drop of Stikistix - Very Berry Chews 15-Pack (150mg) at -10.92% and rank 4; this divergence signals flavor-led rotation toward rosin SKUs within a concentrated portfolio. While CBD/CBG/CBN/THC 1:1:1:1 Fizzy Peach Lemonade Soft Chew (10mg CBG, 10mg CBN, 10mg THC, 10mg CBD) held rank 2 with just -1.70% MoM on $88,174, its 4-Pack counterpart at rank 9 fell -28.09%, implying pack-size elasticity where trial formats give back share faster than full-size. The product mix points to near-term reliance on Edible gummies with growing traction for rosin and multi-cannabinoid formulas, suggesting Olli should pivot assortment and promo weight toward rosin-forward SKUs and de-risk smaller pack sizes.
Top Selling Cannabis Brands
Data for this report comes from real-time sales reporting by participating cannabis retailers via their point-of-sale systems, which are linked up with Headset’s business intelligence software. Headset’s data is very reliable, as it comes digitally direct from our partner retailers. However, the potential does exist for misreporting in the instance of duplicates, incorrectly classified products, inaccurate entry of products into point-of-sale systems, or even simple human error at the point of purchase. Thus, there is a slight margin of error to consider. Brands listed on this page are ranked in the top twenty within the market and product category by total retail sales volume.

