.svg)

Sep-2026
Sales
Trend
6-Month
Product Count
SKUs
Avg Price
YoY Sales Change
YoY Price Change


Where to Buy
Big Pete's Treats is stocked at 507 licensed dispensaries across California, Missouri, and 5 other states, 308 of them in California, with the deepest coverage in San Diego, Sacramento, Los Angeles, San Jose, and La Mesa. Search by ZIP code or city below to find the closest one, or filter by product type if you are after a specific format.
Market Insights Snapshot
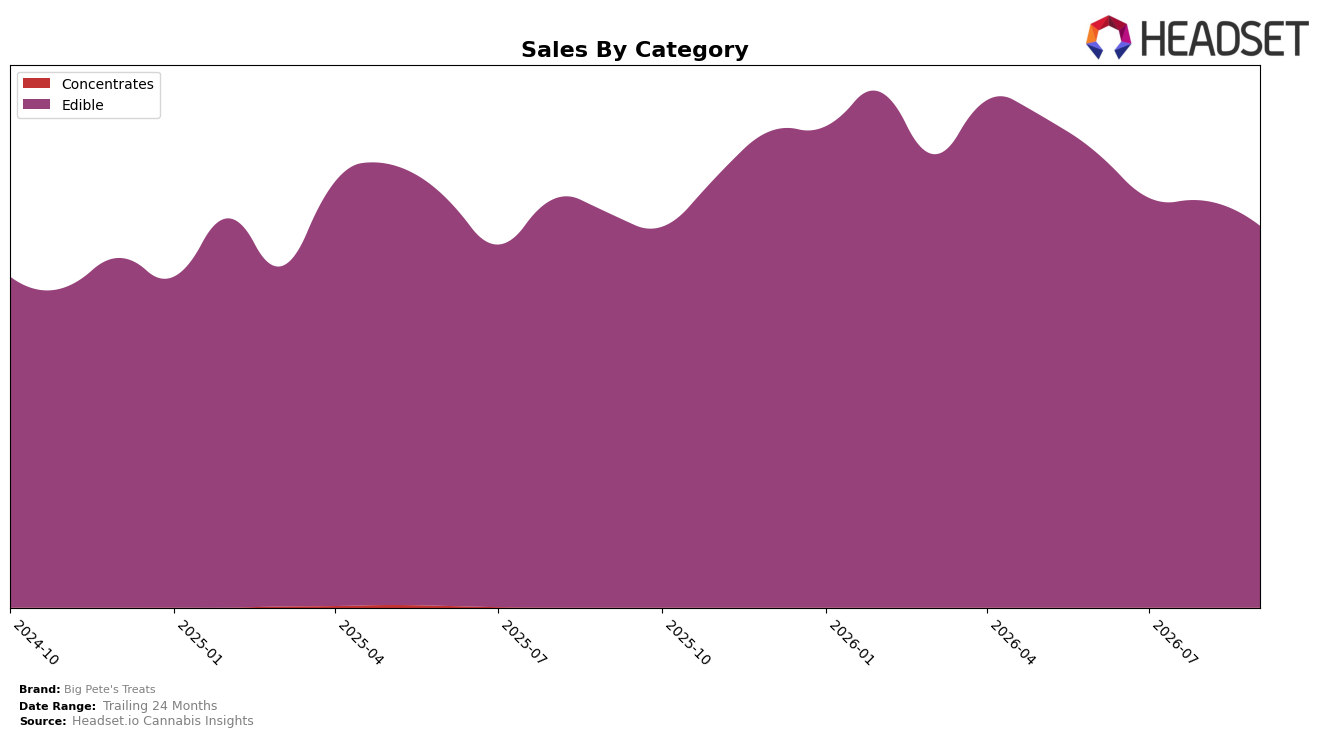
In September 2026, Big Pete's Treats operated as a single-category brand with Edible accounting for 100.0% of sales, while overall Edible sales fell 3.27% year over year and declined 6.14% month over month. Average price moved down 3.51% YoY to $13.27, and within California Edibles the brand held rank 19, indicating a stable mid-pack placement despite the MoM contraction. The pattern implies that reliance on a sole category amplified sensitivity to short-cycle demand shifts, with price cuts not offsetting volume softness on a monthly basis.
These shifts position Big Pete's Treats as a value-leaning Edible player whose 3.51% YoY price decrease has not converted into share gains, given a 3.27% YoY sales decline alongside a 6.14% MoM dip. Sitting at rank 19 in California while maintaining 100.0% category concentration suggests limited defensive insulation against Edible-specific volatility and room to refine pricing-pack architecture to stabilize rank trajectory. The implication is that the current pricing stance and single-category focus constrain upward mobility in competitive tiers surrounding rank 19, and tactical changes are required to prevent further MoM slippage while pursuing longer-horizon recovery after a 24‑month gain of 19.28%.
Competitive Landscape
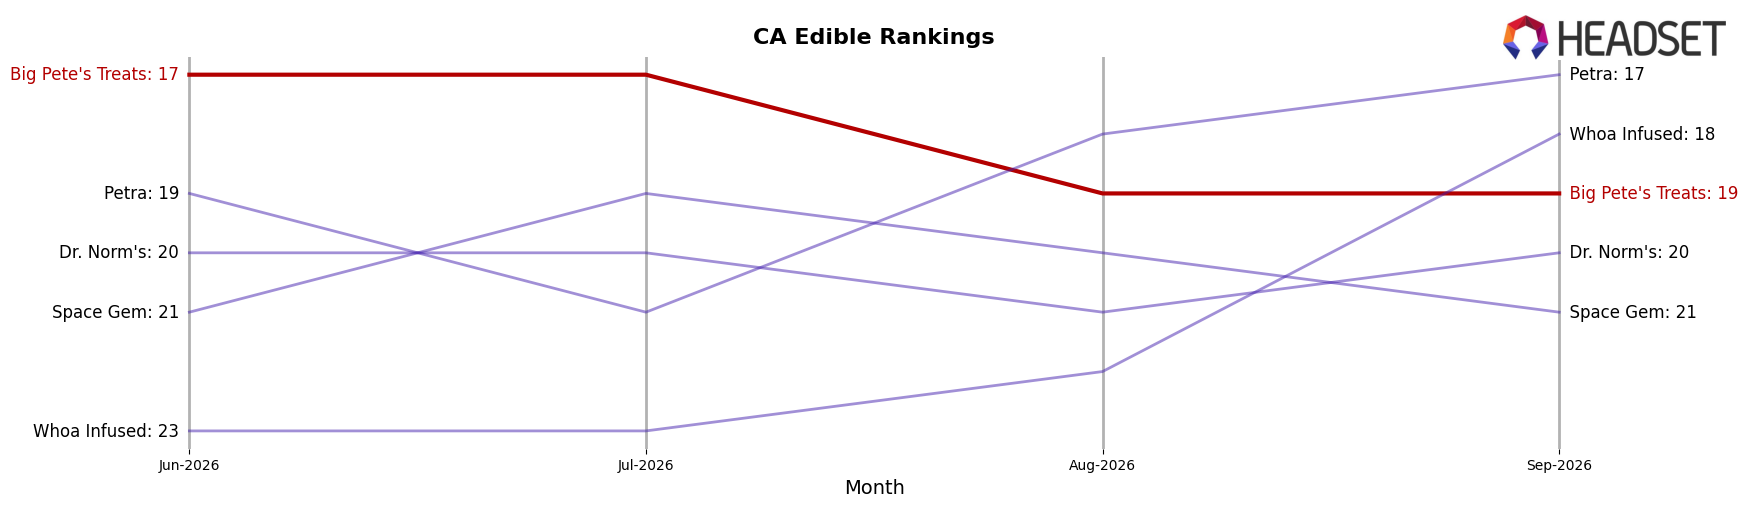
Big Pete's Treats sits at rank #19 in CA Edible for September 2026, unchanged from #19 year over year, after slipping 2 positions from #17 in June 2026 and down 4 positions from its peak at #15 in April 2026; meanwhile, Wyld held #1 with a -21.97% YoY sales change and Camino maintained #2 with +10.39% YoY sales, indicating that Big Pete's Treats is stable in mid-tier ranks while leaders consolidate share despite mixed growth. This flat YoY rank at #19 alongside a 2-position slide since the recent three-month mark implies a stalled trajectory that risks gradual share erosion unless momentum is recaptured from steadily positioned competitors.
Notable Products
Sleepy Time - THC/CBN 2:1 Indica Chocolate Chip Mini Cookies 10-Pack (100mg THC, 50mg CBN) posted the steepest decline at -12.99% while dropping into rank 6, and Indica Birthday Cake Crispy Marshmallow Treat (100mg) slid -12.33% at rank 9, signaling pressure on CBN-indicated and novelty flavors in September 2026. In contrast, Crispy Marshmallow Treat (100mg) climbed +18.01% at rank 7 versus Pineapple & Guava Live Rosin Gummies 10-Pack (100mg) up +9.61% at rank 1, and Chocolate Chip Mini Cookies 10-Pack (100mg) fell -7.53% while holding rank 3, indicating a tilt from infused cookie formats toward classic bars and live rosin gummies. Eight of the top ten are Edible SKUs, with cookies and marshmallow treats concentrated across ranks 3, 6, 7, 8, and 9, and only one SKU shows a month-on-month gain above +15% while two decline below -12%, pointing to volatile flavor-led rotations rather than broad category expansion. The mix implies Big Pete's Treats is pivoting share toward fast-turn base recipes and live rosin positioning while CBN cookie variants and celebratory flavors face rationalization risk.
Top Selling Cannabis Brands






Data for this report comes from real-time sales reporting by participating cannabis retailers via their point-of-sale systems, which are linked up with Headset’s business intelligence software. Headset’s data is very reliable, as it comes digitally direct from our partner retailers. However, the potential does exist for misreporting in the instance of duplicates, incorrectly classified products, inaccurate entry of products into point-of-sale systems, or even simple human error at the point of purchase. Thus, there is a slight margin of error to consider. Brands listed on this page are ranked in the top twenty within the market and product category by total retail sales volume.

