Jun-2026
Sales
Trend
6-Month
Product Count
SKUs
Avg Price
YoY Sales Change
YoY Price Change
Market Insights Snapshot
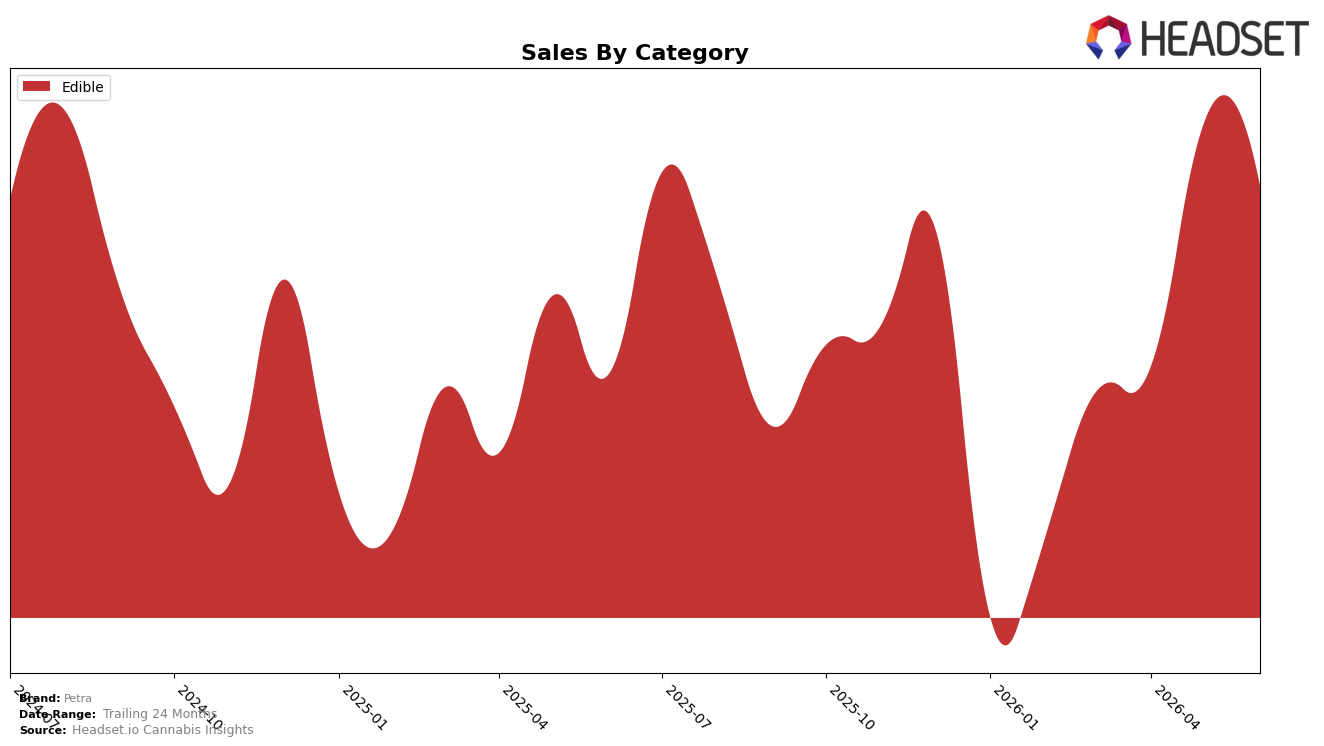
In June 2026, Petra’s mix is fully concentrated in Edible at 100.0% share, with category sales up 12.6% year over year while dipping 3.7% month over month; the average price rose 5.5% YoY to $16.94 and edged down versus May 2026 in unit terms implied by the MoM sales decline. Within California Edible, Petra held rank 19, pairing double‑digit YoY growth with a single‑category dependence, which implies momentum is tied to Edible cycles rather than cross‑category diversification.
The shift toward higher average price alongside negative MoM sales indicates price-led YoY gains but near-term elasticity pressure, and a sole-category footprint at 100.0% share amplifies exposure to Edible seasonality and promotional cadence. Holding rank 19 in California while growing 12.6% YoY suggests Petra’s positioning skews toward maintaining shelf presence through pricing power rather than expanding assortment breadth, implying that future share gains will require either deeper promotion to offset MoM softness or selective category adjacency tests to reduce single-category risk.
Competitive Landscape
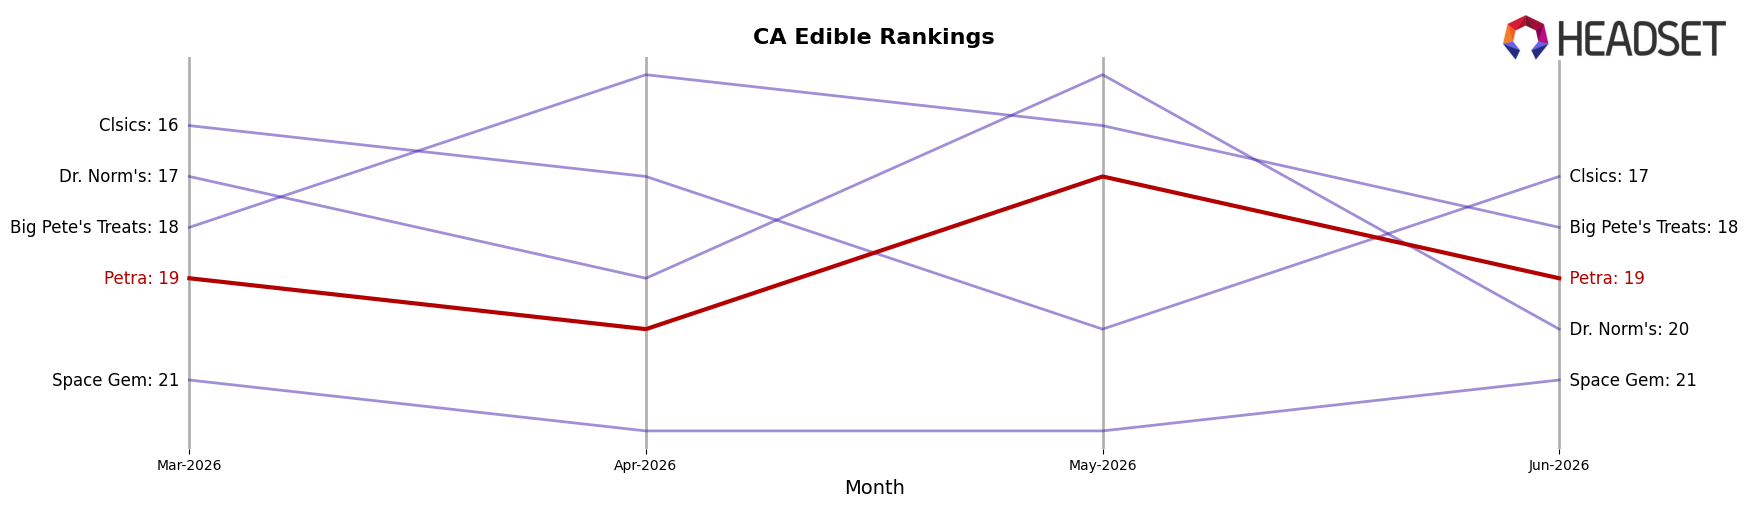
Petra sits at rank #19 in CA Edible for June 2026, unchanged from #19 year over year, and also flat versus three months ago at #19; this stability contrasts with Wyld holding #1 while posting a -1.9% year-over-year sales change and Camino remaining #2 with a 12.9% year-over-year increase. Despite Petra’s historical peak at #16 in July 2024, the lack of movement from #19 across 12 months and the simultaneous upward sales momentum at Kanha / Sunderstorm (+10.9% YoY at #3) implies Petra’s rank is anchored by competitive gains at the top rather than internal decline, signaling that incremental share wins will likely require outpacing competitors with double-digit growth rather than relying on category drift.
Notable Products
Pineapple Mints 20-Pack (100mg) posted the steepest contraction at -33.5% MoM while slipping to rank 10, contrasted by THC/CBN 2:1 Blackberry Mints 40-Pack (100mg THC, 40mg CBN) rising +13.0% MoM at rank 6 and the related THC/CBN 2:1 Blackberry Mints 40-Pack (110mg THC, 55mg CBN) up +10.4% MoM at rank 3. Moroccan Mints 40-Pack (100mg) held rank 1 despite a -6.0% MoM dip, while CBD/THC 1:1 Saigon Cinnamon Mints 40-Pack (100mg CBD, 100mg THC) fell -11.5% MoM at rank 4; four of the top ten are Blackberry or Tart Cherry mint SKUs, indicating flavor-family concentration. The mix shows multi-cannabinoid Blackberry formats taking share from classic flavors, with the sharp decline in Pineapple 20-Pack compressing the lower-price entry point and pushing volume toward higher-rank 40-Pack formats.
Top Selling Cannabis Brands
Data for this report comes from real-time sales reporting by participating cannabis retailers via their point-of-sale systems, which are linked up with Headset’s business intelligence software. Headset’s data is very reliable, as it comes digitally direct from our partner retailers. However, the potential does exist for misreporting in the instance of duplicates, incorrectly classified products, inaccurate entry of products into point-of-sale systems, or even simple human error at the point of purchase. Thus, there is a slight margin of error to consider. Brands listed on this page are ranked in the top twenty within the market and product category by total retail sales volume.

