.svg)

Sep-2026
Sales
Trend
6-Month
Product Count
SKUs
Avg Price
YoY Sales Change
YoY Price Change


Where to Buy
Dr. Norm's is stocked at 463 licensed dispensaries across California, with the deepest coverage in Los Angeles, Sacramento, San Diego, San Francisco, and San Jose. Search by ZIP code or city below to find the closest one, or filter by product type if you are after a specific format.
Market Insights Snapshot
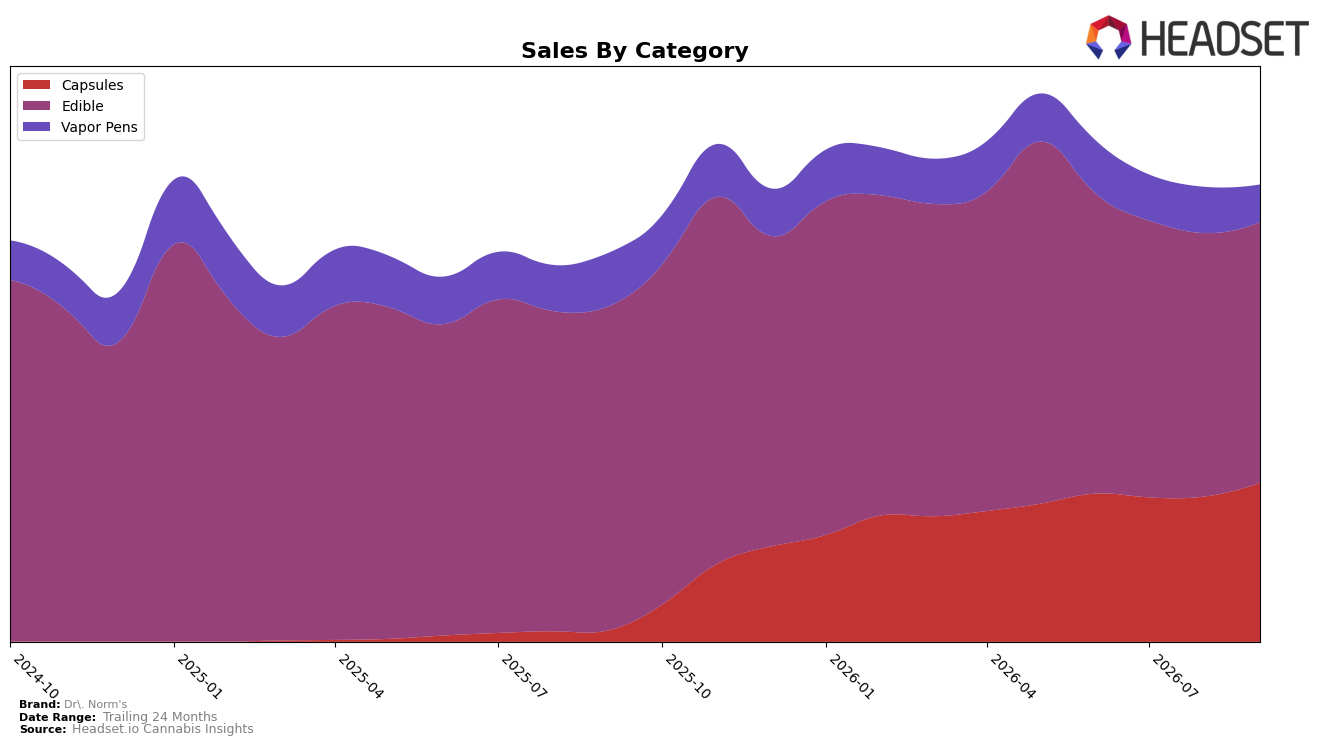
Dr. Norm's shifted its mix in September 2026 toward Capsules, with share at 34.8% while Edible held 57.1% and Vapor Pens 8.2%; within this, Capsules posted 1,330.98% YoY and 9.50% MoM growth, whereas Edible fell 19.57% YoY and 1.03% MoM, and Vapor Pens declined 29.86% YoY and 18.91% MoM. Despite category divergence, overall brand sales rose 17.65% YoY and the average price increased 10.25% YoY to $13.94, implying pricing and product mix are offsetting Edible and Vapor Pens contraction even as Edible remains the lead category.
Positioning now tilts toward higher-priced wellness use-cases as Capsules average $21.80 versus $10.92 for Edible and $22.95 for Vapor Pens, while Dr. Norm's holds rank 20 in Edible in California and Edible share simultaneously fell 19.57% YoY and 1.03% MoM. The combination of Capsule share reaching 34.8% alongside Vapor Pens dropping 18.91% MoM and 29.86% YoY suggests emphasis on efficacy-led formats over inhalables, implying that near-term differentiation will come from sustaining Capsule velocity while selectively defending the Edible position tied to rank 20 in a mature market.
Competitive Landscape
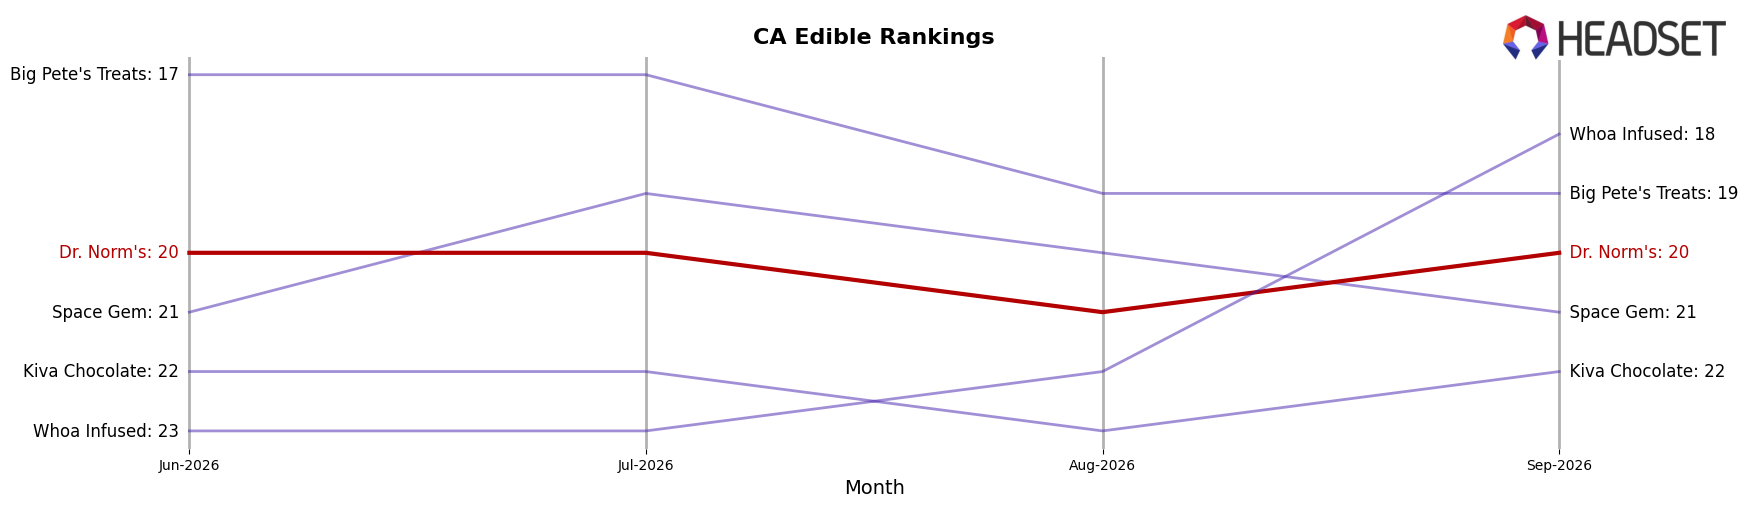
Dr. Norm's sits at rank #20 in CA Edible for September 2026, down 4 positions year over year from #16, while holding flat versus June 2026 at #20; the brand’s peak of #14 in January 2025 is now 6 spots higher than today, indicating a two-step slide from peak to current. Competitive context is bifurcated: Wyld holds #1 with an estimated -22.0% YoY sales change yet retains top rank, whereas Kanha / Sunderstorm remains #3 with roughly +11.4% YoY growth, and Good Tide stays #5 with about +10.1% YoY growth, implying that Dr. Norm's downward rank drift from #16 to #20 occurred amid share consolidation at the top despite mixed growth rates; the trajectory suggests the brand’s position is vulnerable unless it can convert stability since June 2026 at #20 into upward movement against faster-growing top-5 incumbents.
Notable Products
Sleepwell - THC/CBD/CBG/CBN Sweet Dreams Distillate Disposable (1g) posted the steepest decline in September 2026 at -19.95% and slid to rank 7, while Fruity Pebbles Rice Crispy Bar (100mg) fell -9.79% to rank 8, indicating volatility outside the core ingestibles. Indica Max Tablets 20-Pack (1000mg) rose 13.58% to hold rank 1 and Sativa Max Tablets 20-Pack (1000mg) dipped -5.11% yet sat at rank 6, showing Capsules anchoring the leaderboard even as the Vape item retrenched. Wicked Watermelon Hash Gummy (100mg) advanced 27.83% to rank 3 and, with multiple Edibles also in ranks 2, 4, 5, 8, 9, and 10, seven of the top ten are Edible SKUs, pointing to a mix skew that concentrates demand in chews while hardware softens. The product mix implies Dr. Norm's is consolidating around ingestible formats—Capsules for repeatable utility and flavor-forward Edibles for trial—while deprioritizing Vapor Pens as a near-term growth vector.
Top Selling Cannabis Brands






Data for this report comes from real-time sales reporting by participating cannabis retailers via their point-of-sale systems, which are linked up with Headset’s business intelligence software. Headset’s data is very reliable, as it comes digitally direct from our partner retailers. However, the potential does exist for misreporting in the instance of duplicates, incorrectly classified products, inaccurate entry of products into point-of-sale systems, or even simple human error at the point of purchase. Thus, there is a slight margin of error to consider. Brands listed on this page are ranked in the top twenty within the market and product category by total retail sales volume.

