.svg)


Market Insights Snapshot
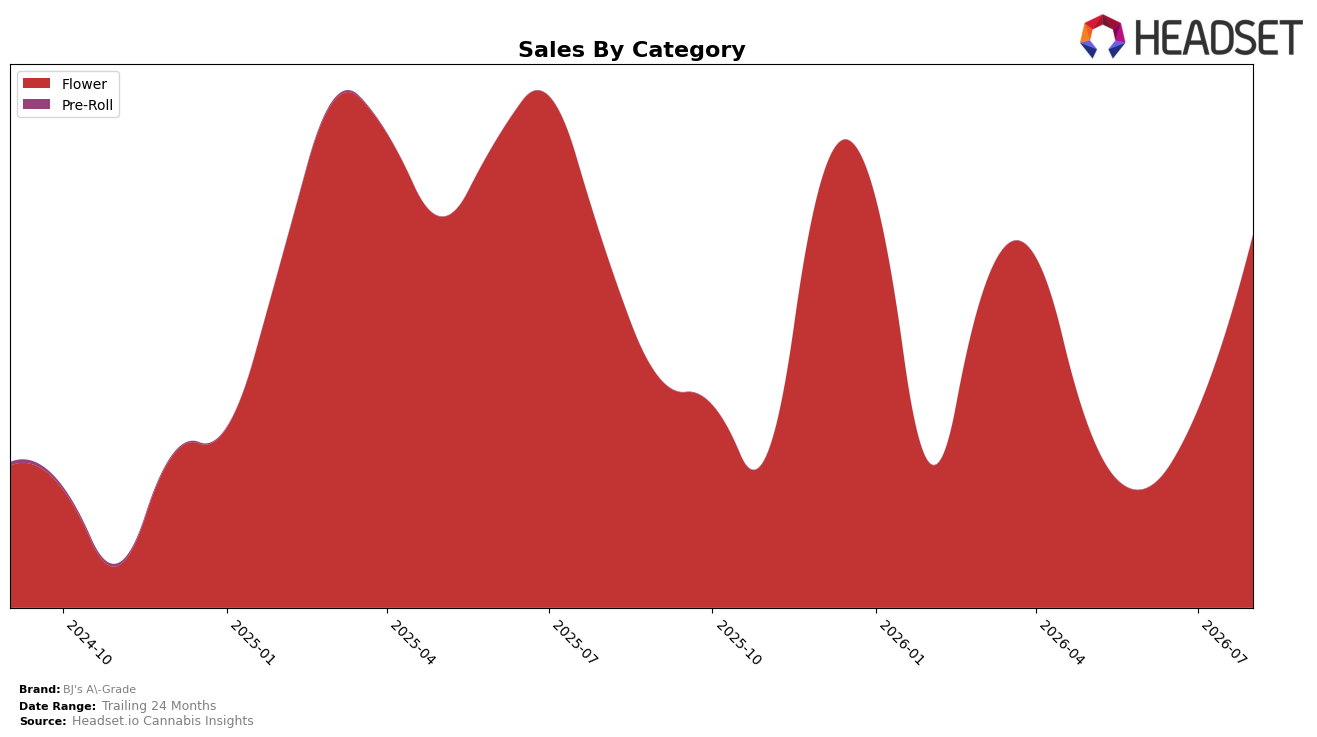
In August 2026, BJ's A-Grade operated as a single-category brand with Flower at 100.0% mix, posting a month-over-month sales change of 88.57% alongside a year-over-year change of 3.27%. Average price rose 37.58% year over year to $16.19, while category share concentration remained at 100.0%, indicating no diversification. Within Oregon Flower, the brand held rank 29, and the 24-month sales lift of 106.16% contrasts with the more modest 3.27% year-over-year result. The pattern implies that August 2026 was driven by a short-term volume or distribution surge layered on a price reset, with concentrated exposure limiting buffer against category-specific swings.
Given the 88.57% month-over-month spike concurrent with a 37.58% price increase and a flat 100.0% category mix, the brand’s positioning leans on Flower depth rather than portfolio breadth, with rank 29 in Oregon suggesting mid-tier visibility. The 3.27% year-over-year gain against a 106.16% two-year expansion signals deceleration as the base builds, while the August 2026 jump indicates episodic upside tied to Flower-specific activation or distribution moments. The implication is that defending and improving rank within Flower will hinge on sustaining price-realized volume without diversification, making price architecture and strain/size optimization the primary levers for share momentum.
Competitive Landscape
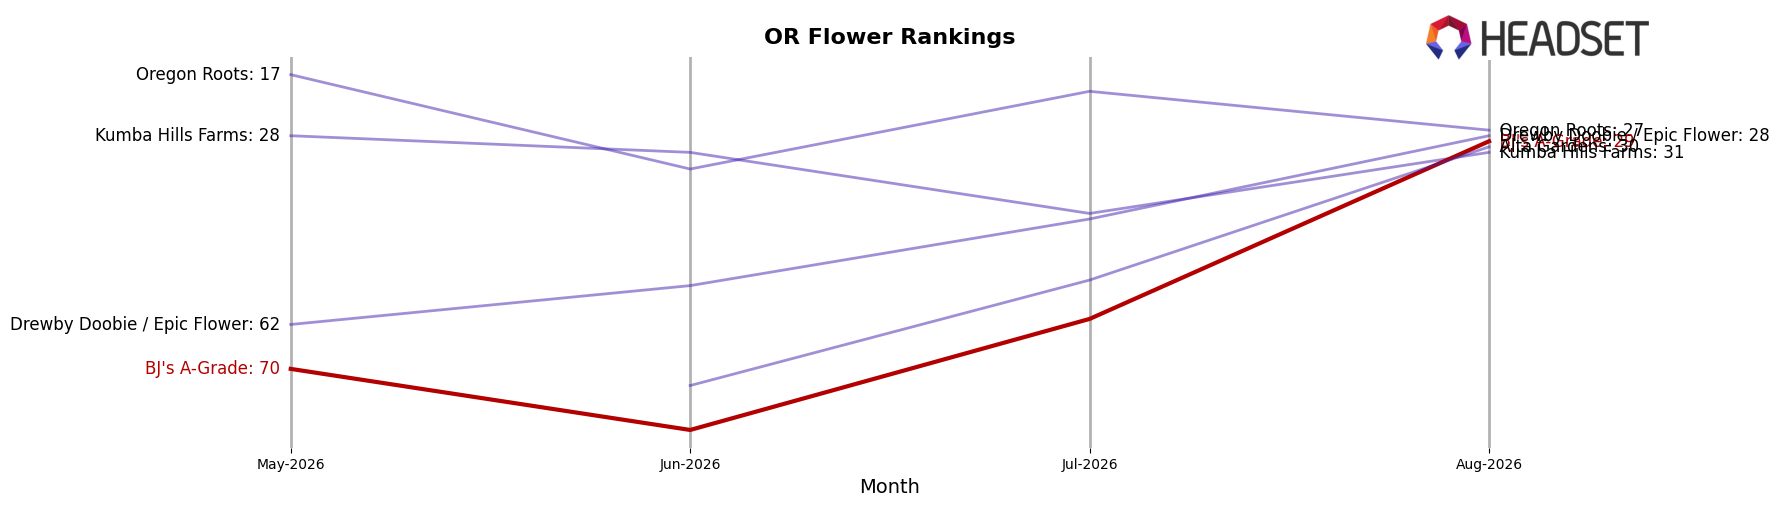
BJ's A-Grade sits at rank #29 in OR Flower for August 2026, a 1-position improvement from #30 year over year, and a 41-position climb from #70 in May 2026, while still trailing its peak at #20 in July 2025; in contrast, Grown Rogue advanced from #3 to #1 with a 49.1% YoY sales increase and Oregrown moved from #23 to #3 alongside 182.4% YoY growth, indicating BJ's A-Grade’s gradual rank gains are lagging rivals’ acceleration and imply that, without a step-change in velocity, mid-tier stability rather than top-tier reentry is the near-term trajectory.
Notable Products
Northern Lights (1g) posted the steepest decline at -81.7% MoM, dropping to rank 5 and signaling a sharp demand reset at the low end of the top tier. New York Purple (1g) delivered a +43.9% MoM rise to rank 3 while Durban Poison (Bulk) fell -12.5% to rank 4, and with four of the top five occupied by Flower SKUs the mix is concentrated in a single category. Blue Dream (1g) held rank 1 with no reported MoM change and together with Kosher Kush (Bulk) at rank 2 these leaders capture the top two spots despite volatility elsewhere, with Blue Dream posting $56,834 in August 2026. The pattern implies BJ's A-Grade is consolidating around flagship Flower strains while pruning or repositioning underperforming singles as volatility concentrates below the top two ranks.
Top Selling Cannabis Brands






Data for this report comes from real-time sales reporting by participating cannabis retailers via their point-of-sale systems, which are linked up with Headset’s business intelligence software. Headset’s data is very reliable, as it comes digitally direct from our partner retailers. However, the potential does exist for misreporting in the instance of duplicates, incorrectly classified products, inaccurate entry of products into point-of-sale systems, or even simple human error at the point of purchase. Thus, there is a slight margin of error to consider. Brands listed on this page are ranked in the top twenty within the market and product category by total retail sales volume.

