Jun-2026
Sales
Trend
6-Month
Product Count
SKUs
Avg Price
YoY Sales Change
YoY Price Change
Market Insights Snapshot
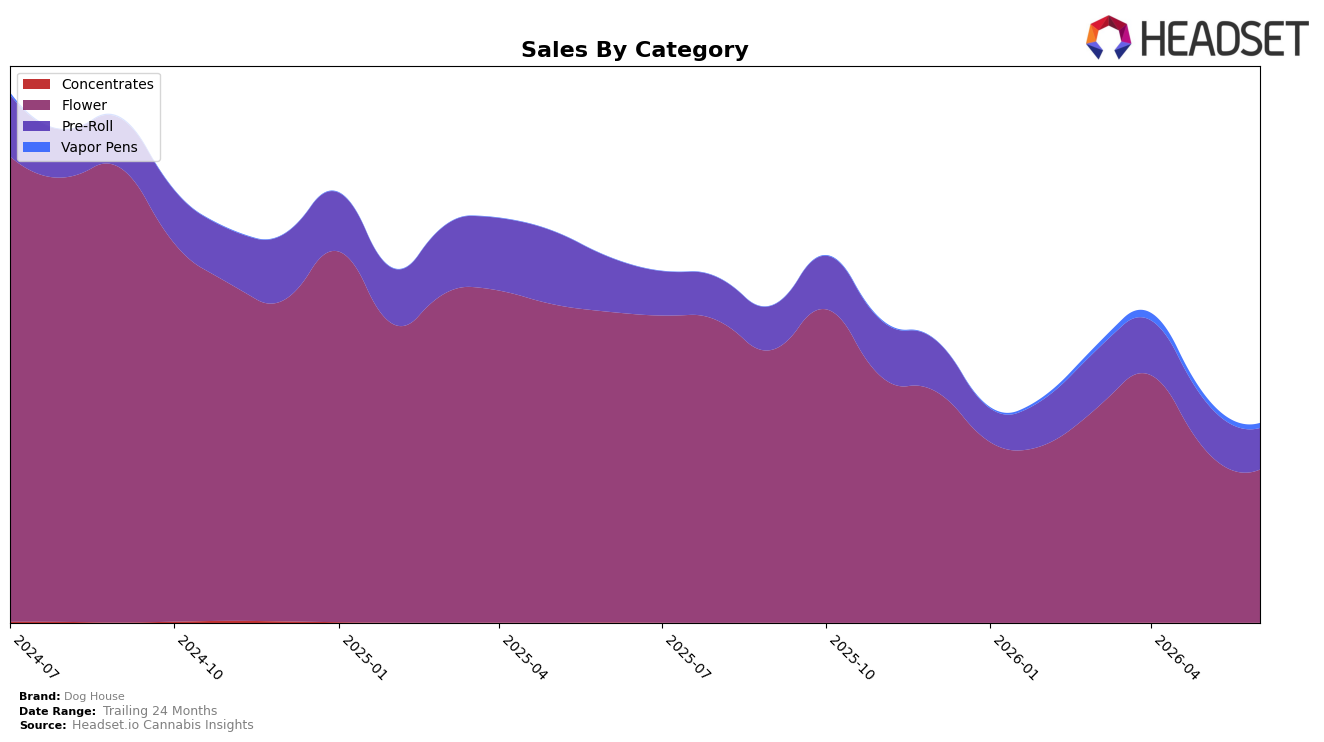
Dog House’s mix in June 2026 is concentrated in Flower at 76.92% share with a year-over-year change of -50.75% and month-over-month change of -11.76%, while Pre-Roll holds 20.70% share with -24.68% YoY and -15.22% MoM. Vapor Pens sits at 2.33% share with a -6.51% MoM shift and no year-over-year baseline, and Concentrates is 0.05% share with -78.62% YoY and -20.00% MoM. With overall brand sales down 45.62% YoY and average price down 40.86% YoY to $15.72, the pattern points to a volume-dependent portfolio where Flower contraction drives most declines, implying that June 2026 softness is structurally tied to overexposure in a retreating core category rather than isolated weakness in smaller lines.
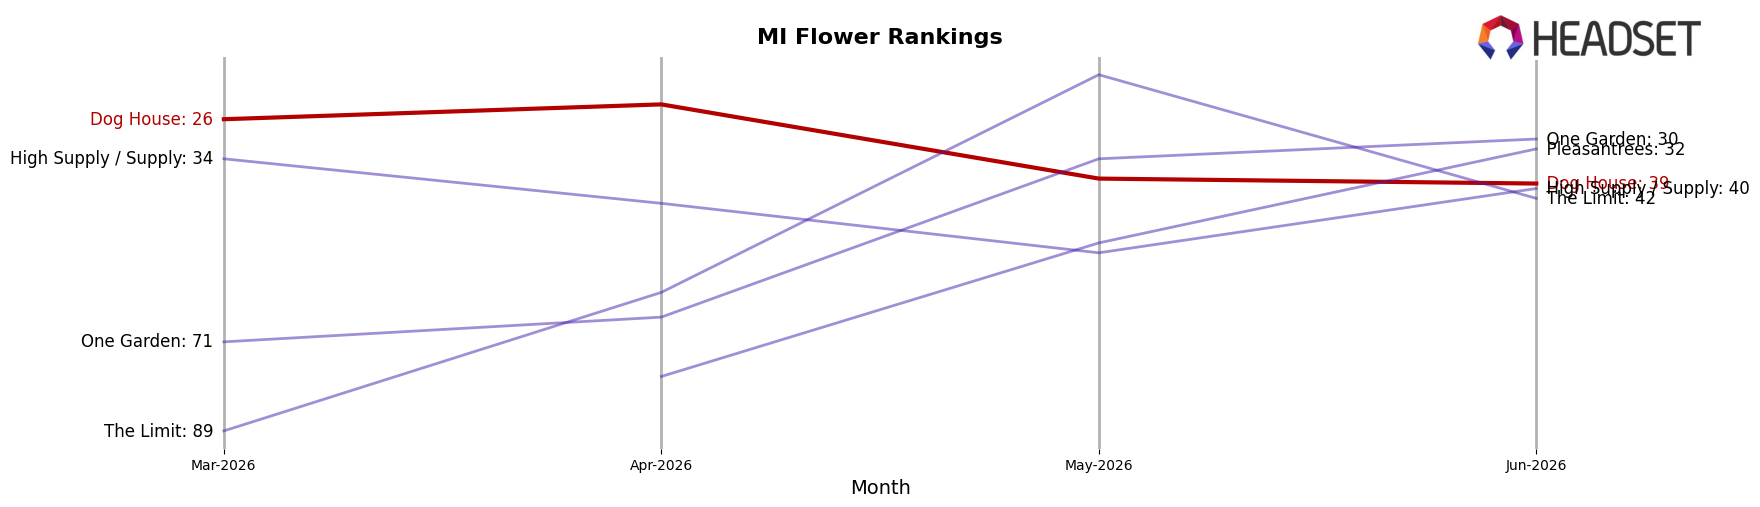
Given a 39 rank in Flower in Michigan alongside a 76.92% category reliance, the -11.76% MoM Flower dip versus a steeper -15.22% MoM in Pre-Roll signals share defense in the core but erosion at the entry-price edge. The 2.33% Vapor Pens share with -6.51% MoM and the 0.05% Concentrates share with -20.00% MoM suggest limited insulation from inhalable diversification, so the positioning implication is that Dog House needs either mix rebalancing toward steadier subcategories or price-pack architecture in Flower to reduce sensitivity to a -50.75% YoY in the anchor category.
Competitive Landscape
Dog House sits at rank #39 in June 2026, down 27 positions year over year from #12, and off 13 places from March 2026’s #26, marking a reversal from its peak at #5 in June 2024; in contrast, High Minded held #1 while posting a -13.7% YoY sales change, and Goodlyfe Farms advanced to #2 from #5 with +44.1% YoY sales growth, indicating Dog House’s rank erosion is occurring amid mixed top-tier momentum and suggests the brand’s trajectory points to declining shelf visibility unless it reclaims share from faster-rising peers.
Notable Products
Candy Cartel Pre-Roll (1g) posted the steepest movement in June 2026 with a -62.9% month-over-month drop while sliding to rank 2, whereas Candy Cartel (Bulk) climbed 59.8% MoM into rank 9; together these shifts imply buyers are reallocating from singles toward value-oriented bulk in the same strain family. Party Animal (Bulk) fell -15.3% MoM at rank 4 while Pink Passion (28g) declined -47.8% at rank 6, and six of the top ten are Flower SKUs, concentrating revenue in larger-format packs despite mixed momentum. With Blue Runtz (1g) holding rank 10 and Pink Passion (Bulk) at rank 7, the assortment’s center of gravity sits in bulk Flower even as a $49,532 lift in Candy Cartel (Bulk) signals selective strain-led switching within that format. The pattern points to Dog House leaning into bulk Flower over single Pre-Rolls, favoring strain families that can convert Pre-Roll demand into higher-volume packs.
Top Selling Cannabis Brands
Data for this report comes from real-time sales reporting by participating cannabis retailers via their point-of-sale systems, which are linked up with Headset’s business intelligence software. Headset’s data is very reliable, as it comes digitally direct from our partner retailers. However, the potential does exist for misreporting in the instance of duplicates, incorrectly classified products, inaccurate entry of products into point-of-sale systems, or even simple human error at the point of purchase. Thus, there is a slight margin of error to consider. Brands listed on this page are ranked in the top twenty within the market and product category by total retail sales volume.

