Market Insights Snapshot
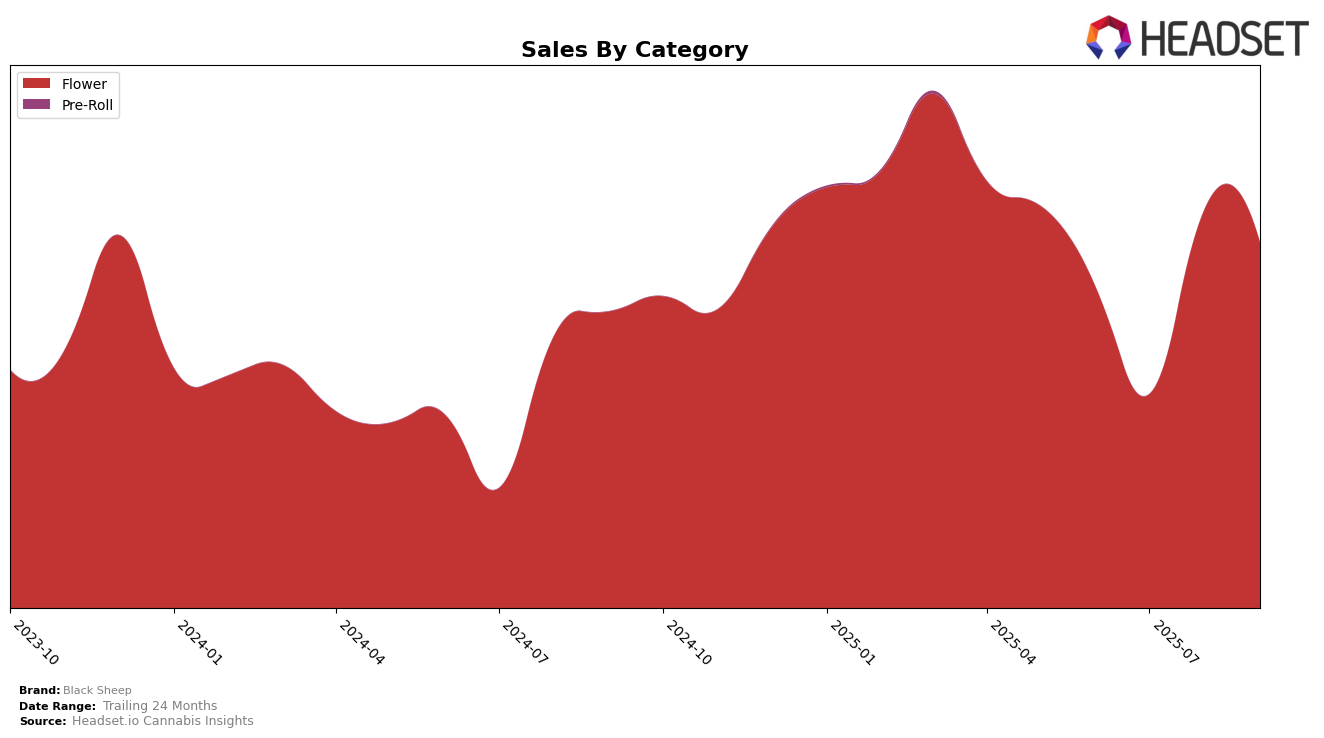
Black Sheep has shown a notable upward trajectory in the Flower category within Ohio. After not appearing in the top 30 rankings in June and July, the brand made a significant leap to the 27th position in August and improved further to 25th in September. This movement suggests that Black Sheep is gaining traction and popularity in the Ohio market, potentially due to strategic changes or increased consumer interest. The rise in ranking from not being in the top 30 to reaching the 25th spot in just two months highlights a positive trend for the brand in this particular state and category.
Despite the positive movement in Ohio, Black Sheep's absence from the top 30 rankings in June and July could indicate challenges earlier in the year, which they appear to be overcoming. The substantial increase in sales from July to August, where sales nearly doubled, reflects this recovery and momentum. However, without data from other states or categories, it's unclear whether this trend is isolated to Ohio or part of a broader national strategy. Observing how Black Sheep continues to perform in the coming months will be crucial to understanding their long-term positioning in the Flower category and across other markets.
Competitive Landscape
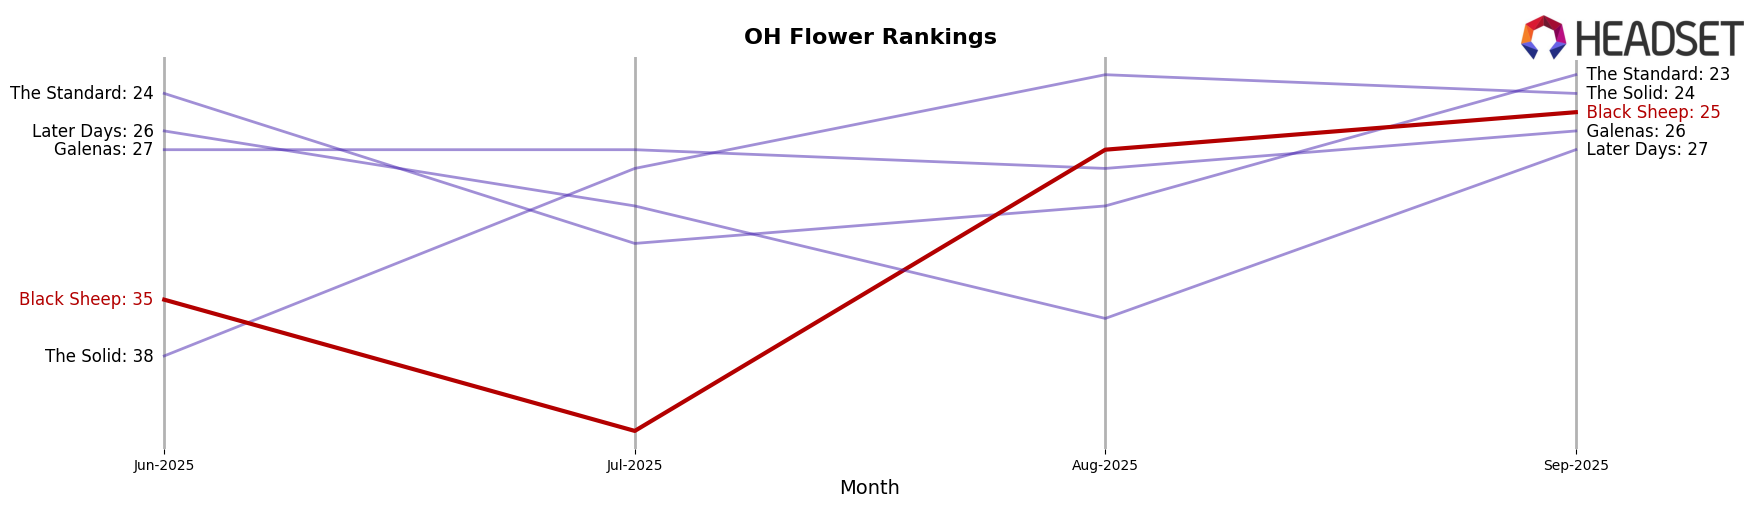
In the competitive landscape of the Ohio flower category, Black Sheep has experienced notable fluctuations in rank and sales over the past few months. Starting from a rank of 35 in June 2025, Black Sheep saw a dip to 42 in July, before climbing back to 27 in August and slightly improving to 25 in September. This upward trend indicates a recovery in market position, potentially driven by strategic adjustments or enhanced product offerings. In contrast, The Solid has shown a remarkable rise, moving from rank 38 in June to 23 by August, suggesting a strong market performance that could pose a competitive threat to Black Sheep. Meanwhile, Galenas and Later Days have maintained relatively stable positions, with Galenas consistently hovering around rank 27-28 and Later Days experiencing a slight decline. Black Sheep's ability to rebound in rank, despite these competitive pressures, highlights its resilience and potential for continued growth in the Ohio flower market.
Notable Products
In September 2025, Black Sheep's top-performing product was Caramel Cake Smalls (14.15g) in the Flower category, climbing to the first rank with notable sales of 921 units. Caramel Cake (2.83g) dropped to the second position from its previous top rank in August. Peach Kush (2.83g) consistently maintained a strong presence, ranking third, though its sales decreased compared to the previous month. Tangerine Drip (2.83g) re-entered the rankings, securing the fourth spot after being unranked in August. Roadkill Cookies Smalls (14.15g) made its debut in the top five, indicating a positive reception among consumers.
Top Selling Cannabis Brands
Data for this report comes from real-time sales reporting by participating cannabis retailers via their point-of-sale systems, which are linked up with Headset’s business intelligence software. Headset’s data is very reliable, as it comes digitally direct from our partner retailers. However, the potential does exist for misreporting in the instance of duplicates, incorrectly classified products, inaccurate entry of products into point-of-sale systems, or even simple human error at the point of purchase. Thus, there is a slight margin of error to consider. Brands listed on this page are ranked in the top twenty within the market and product category by total retail sales volume.

