.svg)



Where to Buy
The Solid is stocked at 101 licensed dispensaries across Missouri, Ohio, and Utah, 65 of them in Missouri, with the deepest coverage in Kansas City, St. Louis, Columbia, Saint Joseph, and Cape Girardeau. Search by ZIP code or city below to find the closest one, or filter by product type if you are after a specific format.
Market Insights Snapshot
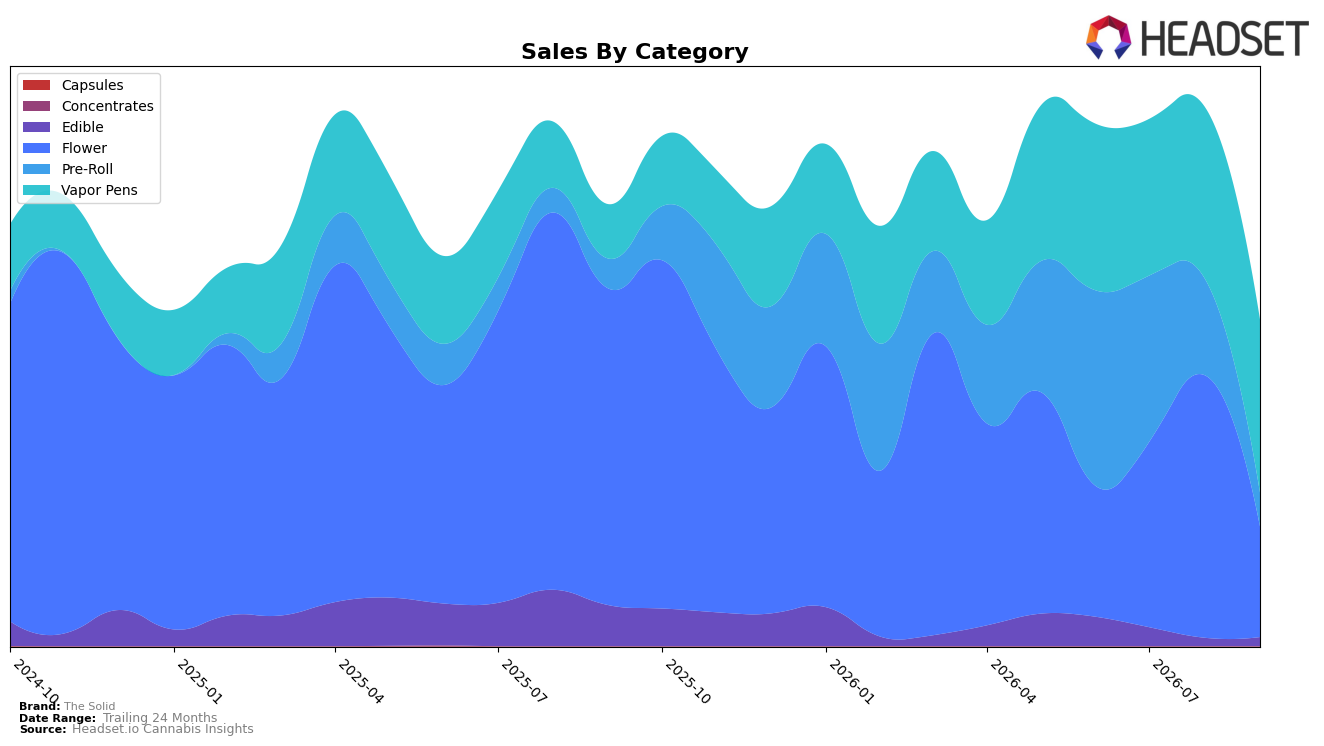
The Solid’s mix in September 2026 pivoted toward Vapor Pens at 53.15% share with 220.00% year-over-year growth and 0.89% month-over-month change, while Flower fell to 33.88% share with -65.15% year-over-year and -57.95% month-over-month. Pre-Roll held 10.28% share with 13.31% year-over-year but -65.34% month-over-month, and Edible was 2.69% share with -78.50% year-over-year and 8.59% month-over-month. Despite overall brand sales down 26.15% year-over-year and average price down 16.61% year-over-year to $23.83, the concentration shift toward higher-price Vapor Pens at $28.18 alongside steep Flower contraction at $33.15 signals a portfolio reweighting toward inhalables that buffers but does not offset aggregate declines.
The September 2026 mix implies a strategic repositioning: commanding more than half of sales in Vapor Pens with 220.00% year-over-year gains while holding rank 33 in Vapor Pens in Missouri suggests category-led focus where incremental share capture is plausible, whereas the -65.15% year-over-year drop and -57.95% month-over-month in Flower indicate retreat from a historically higher-price but weakening lane. With Pre-Roll’s 13.31% year-over-year growth offset by a -65.34% month-over-month correction and Edible’s -78.50% year-over-year contrasting an 8.59% month-over-month uptick, the pattern implies short-term volatility outside Vapor Pens and a need to consolidate positioning around a single lead category rather than spread across contracting or whipsaw segments.
Competitive Landscape
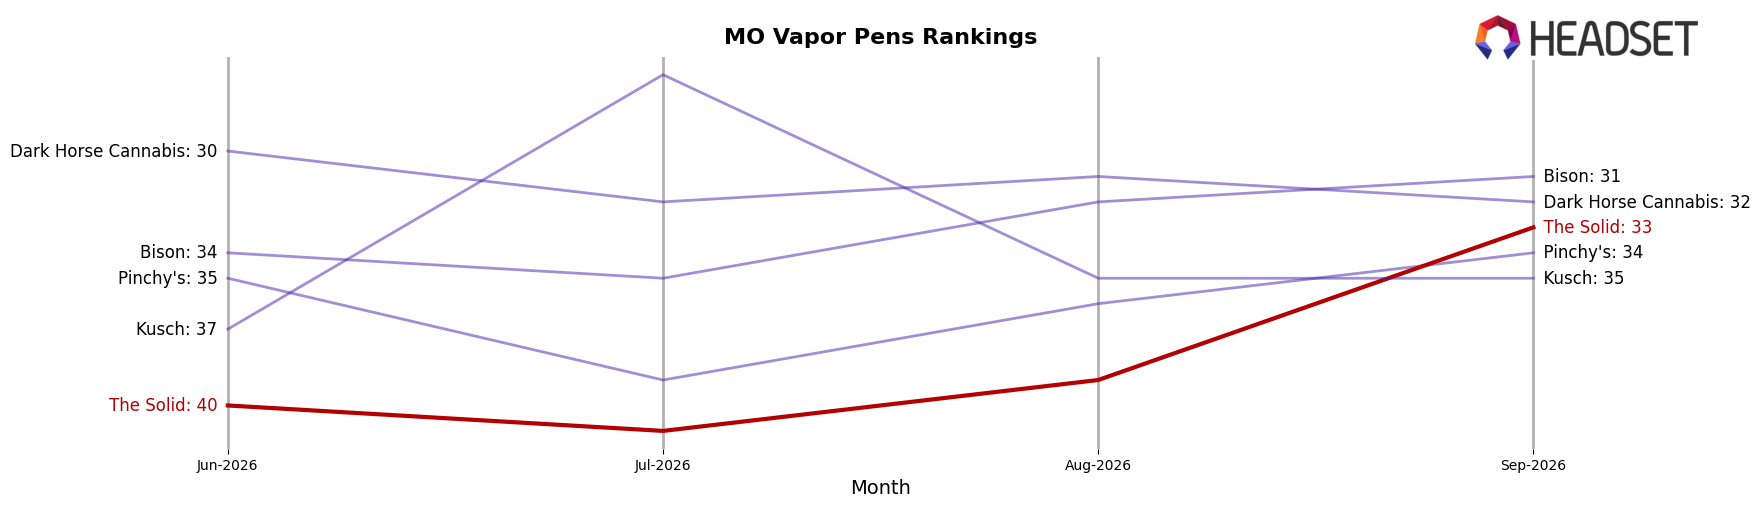
The Solid sits at rank #33 in Missouri Vapor Pens in September 2026, a 28-position climb from #61 year over year, and an improvement of 7 positions from #40 in June 2026; this new peak rank of #33 in September 2026 contrasts with Illicit / Illicit Gardens holding #1 both year over year and currently while growing sales 17.1%, and diverges from Rove sliding from #3 to #5 alongside a -4.3% sales change. Compared with Good Day Farm advancing from #5 to #3 with 35.4% sales growth and Galactic steady at #2 with 20.4% growth, The Solid’s move from #61 to #33 indicates share capture from mid-tier incumbents rather than pressure on the top tier, implying the current trajectory is one of mid-pack consolidation rather than imminent top-10 entry.
Notable Products
Cherry Cookie Runtz (3.5g) defines September 2026 with a -62.9% month-over-month decline while sitting at rank 2, a sharper drop than Blue Skies Distillate Infused Pre-Roll (1g) at -50.0% in rank 4, indicating demand is pivoting away from one of the highest-ranked Flower SKUs even as it retains a top-two position. Western Voodoo Pre-Roll (1g) holds rank 1 with no reported month-over-month rate while Cherry Cookie Runtz (3.5g) is rank 2, and four of the top ten are Vapor Pens occupying ranks 3, 5, 7, 8, and 9, suggesting assortment weight is tilting toward inhalable formats where stability in rank positions can offset volatility in Flower; this mix implies The Solid is consolidating around Pre-Roll and Vapor Pen traffic drivers rather than relying on flagship Flower for headline momentum.
Top Selling Cannabis Brands






Data for this report comes from real-time sales reporting by participating cannabis retailers via their point-of-sale systems, which are linked up with Headset’s business intelligence software. Headset’s data is very reliable, as it comes digitally direct from our partner retailers. However, the potential does exist for misreporting in the instance of duplicates, incorrectly classified products, inaccurate entry of products into point-of-sale systems, or even simple human error at the point of purchase. Thus, there is a slight margin of error to consider. Brands listed on this page are ranked in the top twenty within the market and product category by total retail sales volume.

