Jun-2026
Sales
Trend
6-Month
Product Count
SKUs
Avg Price
YoY Sales Change
YoY Price Change
Market Insights Snapshot
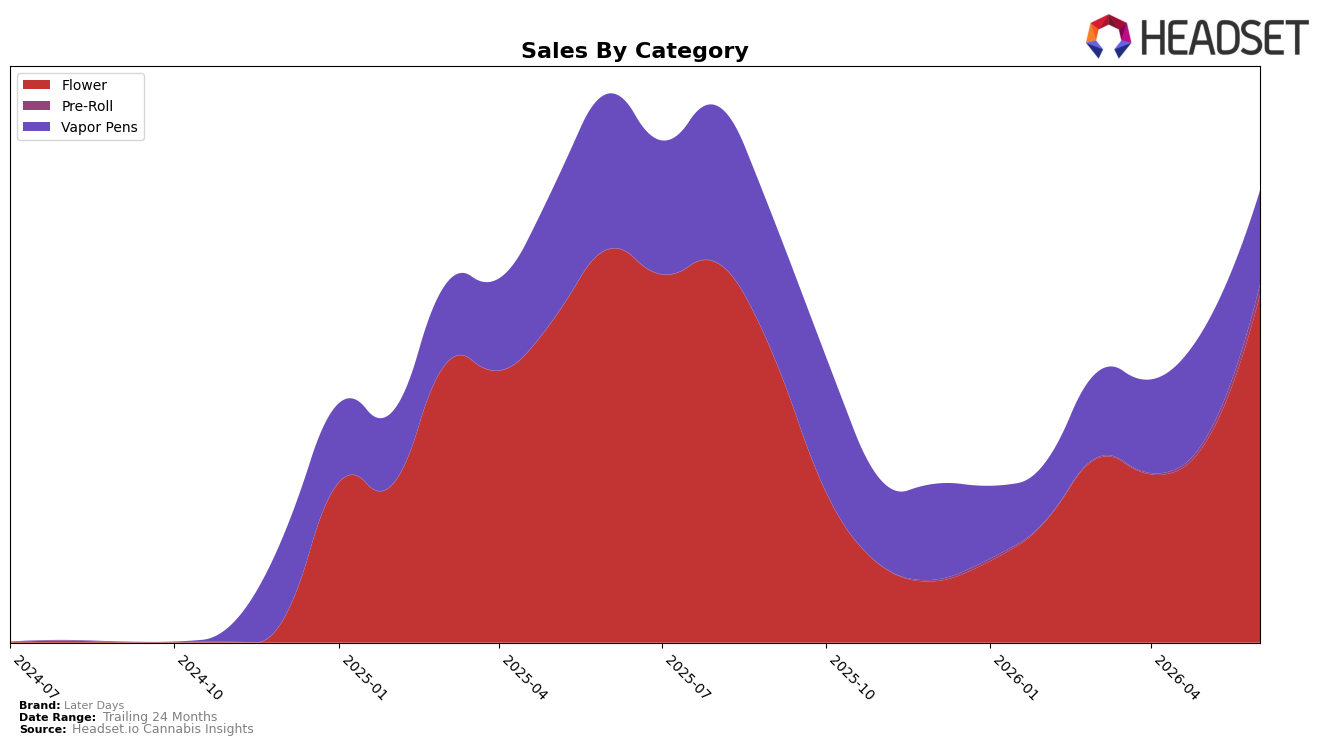
Later Days concentrated 76.97% of June 2026 sales in Flower, up 75.31% month over month within the category while Flower’s year-over-year sales were down 11.63%; Vapor Pens held 20.79% share with a 16.45% MoM decline and a 39.54% YoY decline. Pre-Roll remained small at 2.25% share but spiked 156.69% MoM, with no year-over-year comp available, while the brand’s overall average price fell 16.54% YoY as Flower’s average price sat at $30.94. This mix shift implies a pivot toward Flower-led volume recovery despite annual contraction, with Vapor Pens receding and Pre-Roll acting as an emerging test bed that could diversify contribution if the momentum sustains.
With a 15th rank in Flower in Ohio and 76.97% of sales tied to that category, the June 2026 stance suggests Later Days is competing as a mid-pack Flower specialist rather than a multi-category generalist. The 75.31% MoM Flower surge alongside a 16.45% MoM pullback in Vapor Pens indicates the brand is trading breadth for depth, while the 156.69% MoM Pre-Roll gain points to a lower-price entry route consistent with the 16.54% YoY drop in average price. The implication is a positioning anchored in accessible Flower and value-oriented line extensions that can lift unit throughput without relying on Vapor Pens’ declining trajectory.
Competitive Landscape
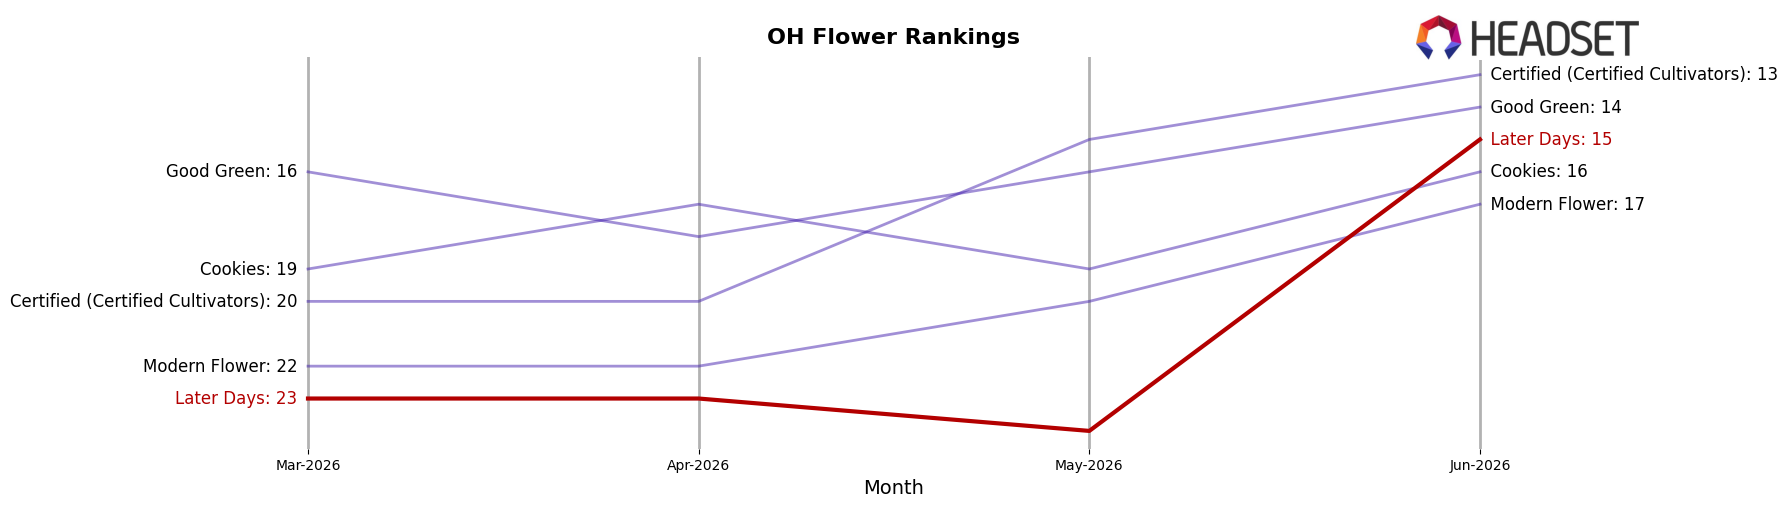
Later Days ranks #15 in OH Flower in June 2026, improving 13 positions from #28 year over year and jumping 8 spots from #23 in March 2026, while also reaching a new peak rank of #15 in June 2026; in contrast, Klutch Cannabis climbed from #20 to #1 with a 304.8% YoY sales increase and Riviera Creek edged up from #1 to #2 despite a -22.7% YoY sales change, indicating that Later Days’ ascent is happening in a tier where leaders are consolidating share and the path from mid-teens to top 10 will require outpacing brands that are either accelerating ranks quickly or defending high positions despite sales declines.
Notable Products
Melonade (2.83g) delivered the standout movement in June 2026 with a 186.8% month-over-month surge to rank 1, while Sherbetz (2.83g) slid 20.0% to rank 4, creating a sharp divergence at the top of the lineup. Bouncing Buddha (2.83g) also accelerated 129.5% month over month to rank 2, and four of the top ten are Flower SKUs ranked 1 through 4, signaling a concentration of momentum in small-pack flower. Large-pack Flower entries such as Square Dance (14.15g) and Star Mintz (14.15g) held ranks 6 and 8 respectively, suggesting volume stability without the MoM spikes seen in 2.83g formats. The pattern implies Later Days is capturing demand with fast-rotating 2.83g launches while using 14.15g Flower to anchor baseline sales, pointing to a two-tier product strategy focused on trial up top and retention in larger formats.
Top Selling Cannabis Brands
Data for this report comes from real-time sales reporting by participating cannabis retailers via their point-of-sale systems, which are linked up with Headset’s business intelligence software. Headset’s data is very reliable, as it comes digitally direct from our partner retailers. However, the potential does exist for misreporting in the instance of duplicates, incorrectly classified products, inaccurate entry of products into point-of-sale systems, or even simple human error at the point of purchase. Thus, there is a slight margin of error to consider. Brands listed on this page are ranked in the top twenty within the market and product category by total retail sales volume.

