.svg)


Market Insights Snapshot
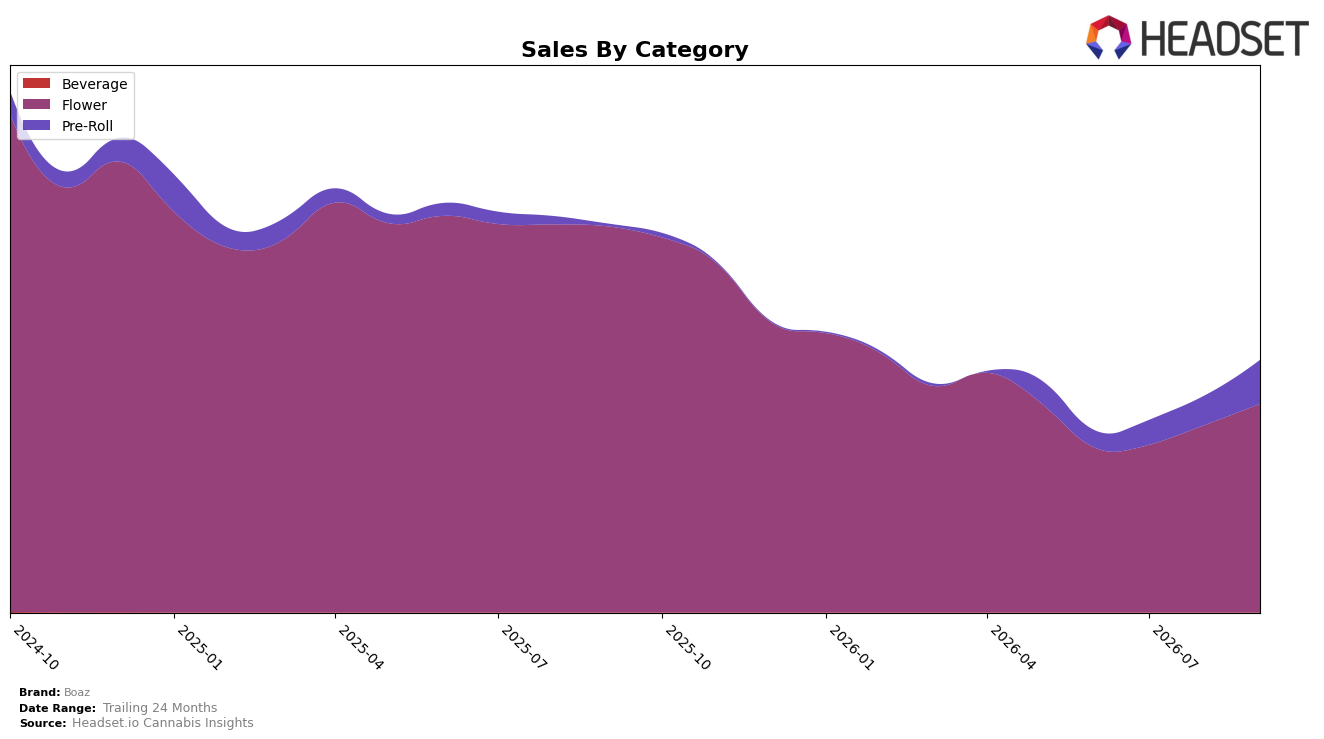
Boaz concentrated 82.66% of September 2026 sales in Flower, where year-over-year sales fell 46.05% while month-over-month rose 11.32%, and held 17.34% in Pre-Roll, which surged 1,724.26% year-over-year and 49.38% month-over-month; alongside this mix, the average price declined 6.38% year-over-year. With Flower ranked 42 in Alberta and Pre-Roll expanding share from a small base, the pattern implies Boaz is rebalancing toward faster-moving Pre-Rolls while still relying on a Flower-heavy base that is contracting year-over-year but recovering month-over-month.
The divergence between a shrinking Flower base (-46.05% YoY) and rapidly scaling Pre-Rolls (+1,724.26% YoY) suggests Boaz is using lower average prices (-6.38% YoY) and format variety to stabilize demand, as evidenced by Flower’s 11.32% MoM uptick and Pre-Roll’s 49.38% MoM lift. Given a 42 rank in Alberta Flower coupled with an 82.66% category share, the implication is that Boaz’s near-term positioning benefits from diversifying into Pre-Rolls to offset Flower exposure, but sustained share gains likely depend on shifting more volume into the faster-growing Pre-Roll segment while leveraging Flower’s incremental month-over-month recovery.
Competitive Landscape
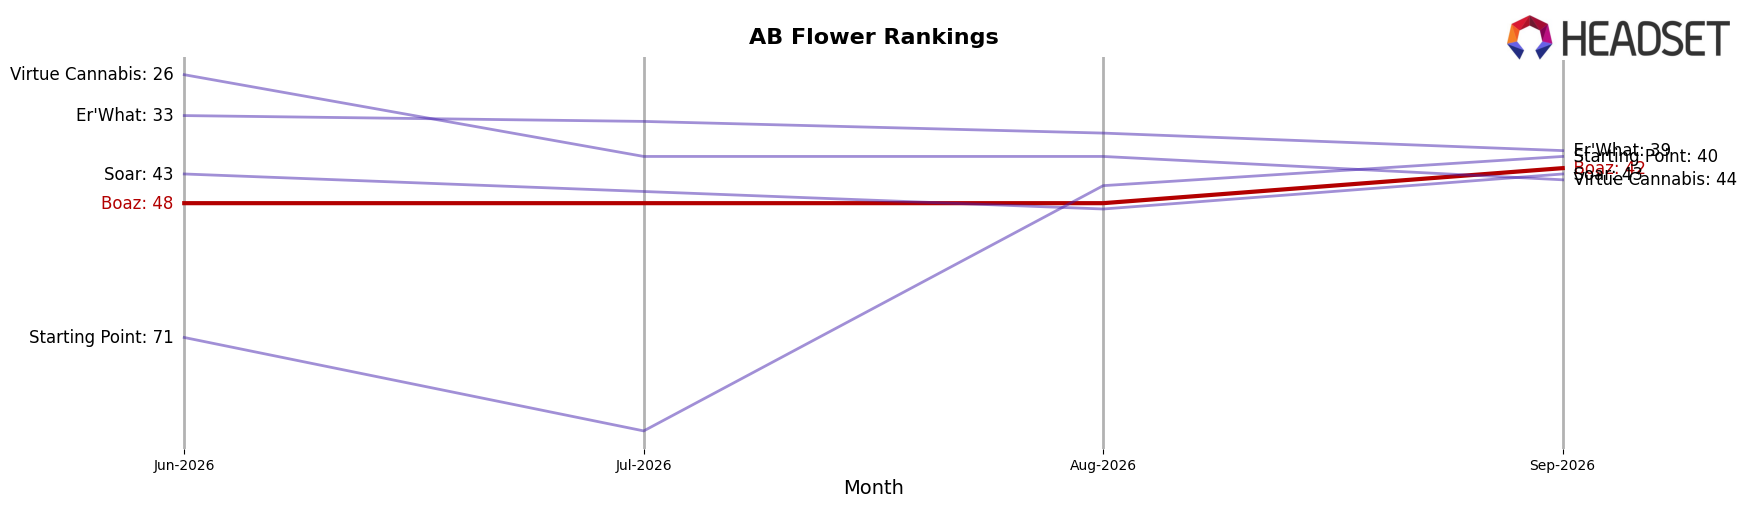
Boaz sits at rank #42 in AB Flower in September 2026, down 14 positions year over year from #28, and 6 spots better than June 2026’s #48, while still trailing its peak of #27 from June 2025; meanwhile, Back Forty / Back 40 Cannabis held #1 despite a -6.7% YoY sales change and Good Supply slipped from #1 to #5 alongside a -43.0% YoY sales decline, indicating that top-tier volatility has not translated into upward mobility for Boaz. With Pure Sunfarms advancing from #5 to #3 on +10.2% YoY growth and FIGR jumping from #11 to #4 on +141.2% YoY, Boaz’s current #42 positioning—despite a 6-rank improvement since June 2026—signals a trajectory of relative share erosion against faster-rising peers.
Notable Products
Windmill - Hybrid Pre-Roll 2-Pack (1g) posted the standout move in September 2026 with a +98.8% month-over-month surge that vaulted it to rank 5, while Daytime Pre-Roll 5-Pack (1.75g) climbed on +40.8% to rank 4. At the top of the table, Windmill- Hybrid Milled (7g) rose +32.1% to hold rank 1 as Windmill Indica Milled (7g) slipped -6.1% yet stayed at rank 3, and four of the top five SKUs are concentrated in Flower and Pre-Roll formats. Combined, the gains in Hybrid milled and both Pre-Roll formats indicate momentum is skewing toward convenience-led and hybrid-forward offerings, suggesting Boaz is tilting its mix toward sessionable formats over purely strain-specific milled options.
Top Selling Cannabis Brands






Data for this report comes from real-time sales reporting by participating cannabis retailers via their point-of-sale systems, which are linked up with Headset’s business intelligence software. Headset’s data is very reliable, as it comes digitally direct from our partner retailers. However, the potential does exist for misreporting in the instance of duplicates, incorrectly classified products, inaccurate entry of products into point-of-sale systems, or even simple human error at the point of purchase. Thus, there is a slight margin of error to consider. Brands listed on this page are ranked in the top twenty within the market and product category by total retail sales volume.

