.svg)


Where to Buy
BON BOMBS is stocked at 33 licensed dispensaries across Washington, with the deepest coverage in Bellingham, Spokane, Lynnwood, Seattle, and Mount Vernon. Search by ZIP code or city below to find the closest one.
Market Insights Snapshot
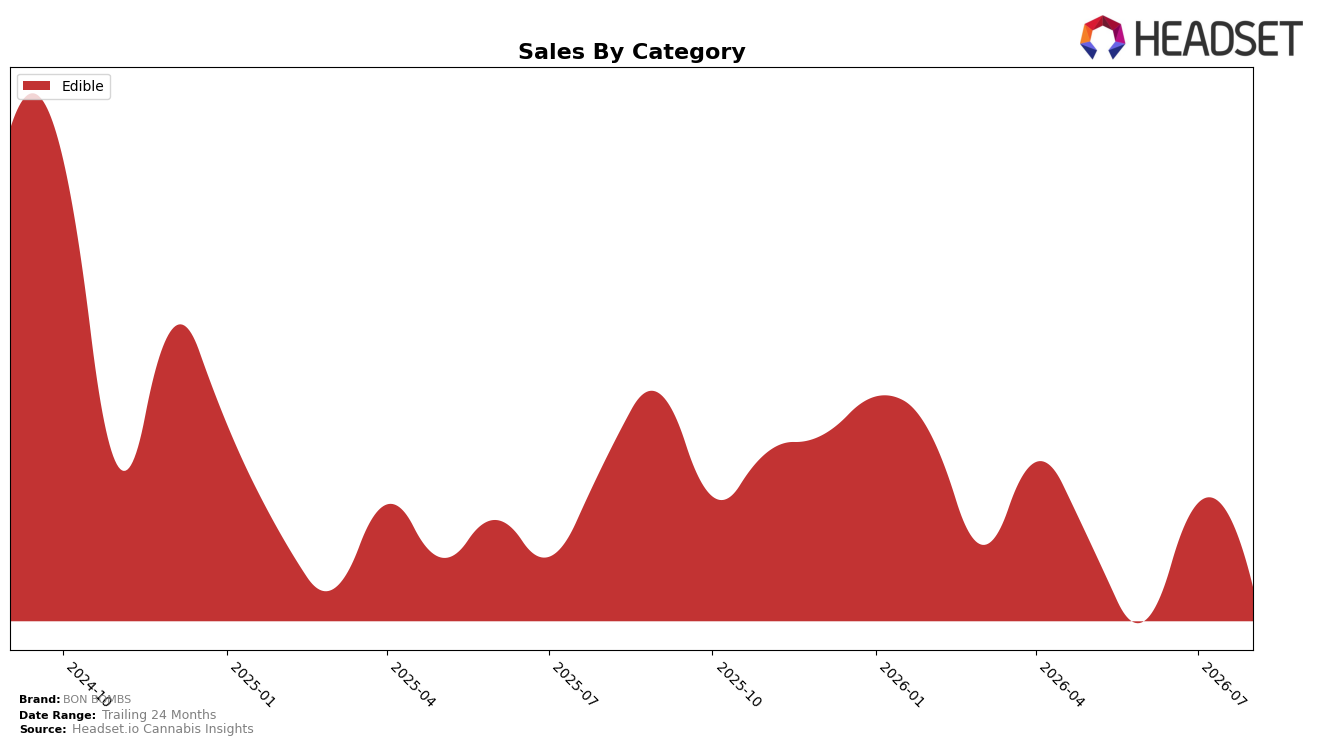
In August 2026, BON BOMBS operated as a single-category brand with Edible accounting for 100.0% of sales, while brand sales declined 10.15% year over year and 7.09% month over month; the Edible category itself mirrored this with a 10.15% YoY drop and a 7.09% MoM slide. Average price rose 4.07% YoY to $17.71, pairing price inflation with volume contraction, and the brand held rank 32 in Edible within Washington. The pattern implies BON BOMBS is overexposed to Edible demand softness, where price increases of 4.07% amid a 7.09% MoM sales decline concentrate risk rather than offset it.
With 100.0% of mix in Edible and a rank of 32 in Washington, the 10.15% YoY decline and 7.09% MoM decline suggest the brand’s pricing at $17.71 is not converting into share defense, given the absence of diversification into faster-moving categories. The divergence between a 4.07% YoY price lift and simultaneous double-digit 24-month contraction of 30.46% indicates that incremental price gains are unlikely to restore trajectory without mix breadth or subsegment focus within Edibles; the implication is that positioning must pivot from price-led tactics to assortment or format-led differentiation to climb above rank 32 and arrest the 7.09% MoM slide.
Competitive Landscape
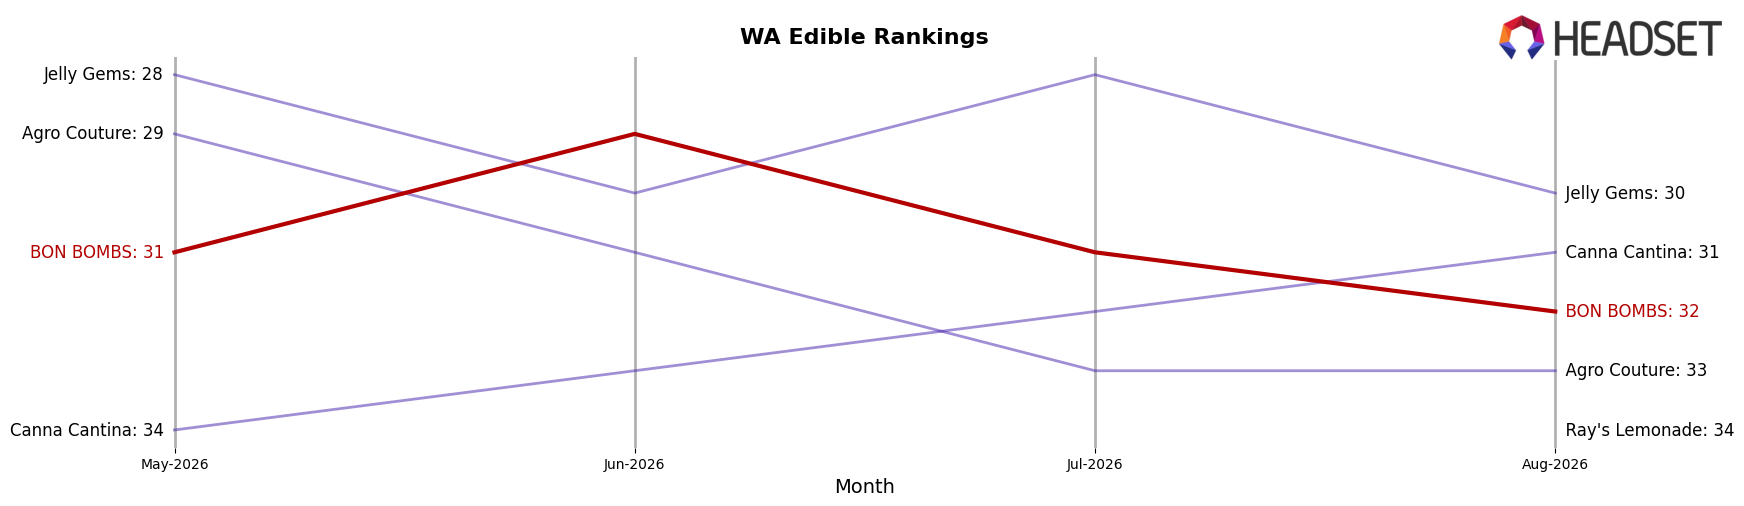
BON BOMBS sits at rank #32 in WA Edible in August 2026, slipping 2 positions year over year from #30 and down 1 spot from #31 three months ago, while its historical peak was #25 in September 2024; in contrast, Wyld held #1 with a 5.1% year-over-year sales increase and Craft Elixirs remained #5 despite a 13.9% year-over-year sales decline, indicating BON BOMBS is losing rank share even as top-tier volatility opens windows to recapture mid-20s placement.
Notable Products
CBD/THC 1:1 Orange Dark Chocolate 10-Pack (100mg CBD, 100mg THC) posted the steepest decline at -32.3% and slid to rank 5, while Sugar Free Dark Chocolate Bites 10-Pack (100mg) fell -25.4% to rank 6. In contrast, CBD/THC 1:1 Classic Milk Chocolate 10-Pack (100mg CBD, 100mg THC) rose +23.4% to hold rank 1 and Mint Cacao Milk Chocolate 10-Pack (100mg) inched up +7.6% at rank 7, creating a split where the 1:1 line gains share as several sugar-free and dark variants retreat. With eight of the top ten as Edible SKUs centered on chocolate 10-Packs and one product crashing -45.9% at rank 8, the assortment is tilting toward balanced-dose milk chocolate formats over niche flavors. This pattern implies BON BOMBS is consolidating volume into a flagship 1:1 platform while trimming demand for specialty dark and sugar-free variants, steering commercial direction toward fewer, higher-velocity leaders.
Top Selling Cannabis Brands






Data for this report comes from real-time sales reporting by participating cannabis retailers via their point-of-sale systems, which are linked up with Headset’s business intelligence software. Headset’s data is very reliable, as it comes digitally direct from our partner retailers. However, the potential does exist for misreporting in the instance of duplicates, incorrectly classified products, inaccurate entry of products into point-of-sale systems, or even simple human error at the point of purchase. Thus, there is a slight margin of error to consider. Brands listed on this page are ranked in the top twenty within the market and product category by total retail sales volume.

