Market Insights Snapshot
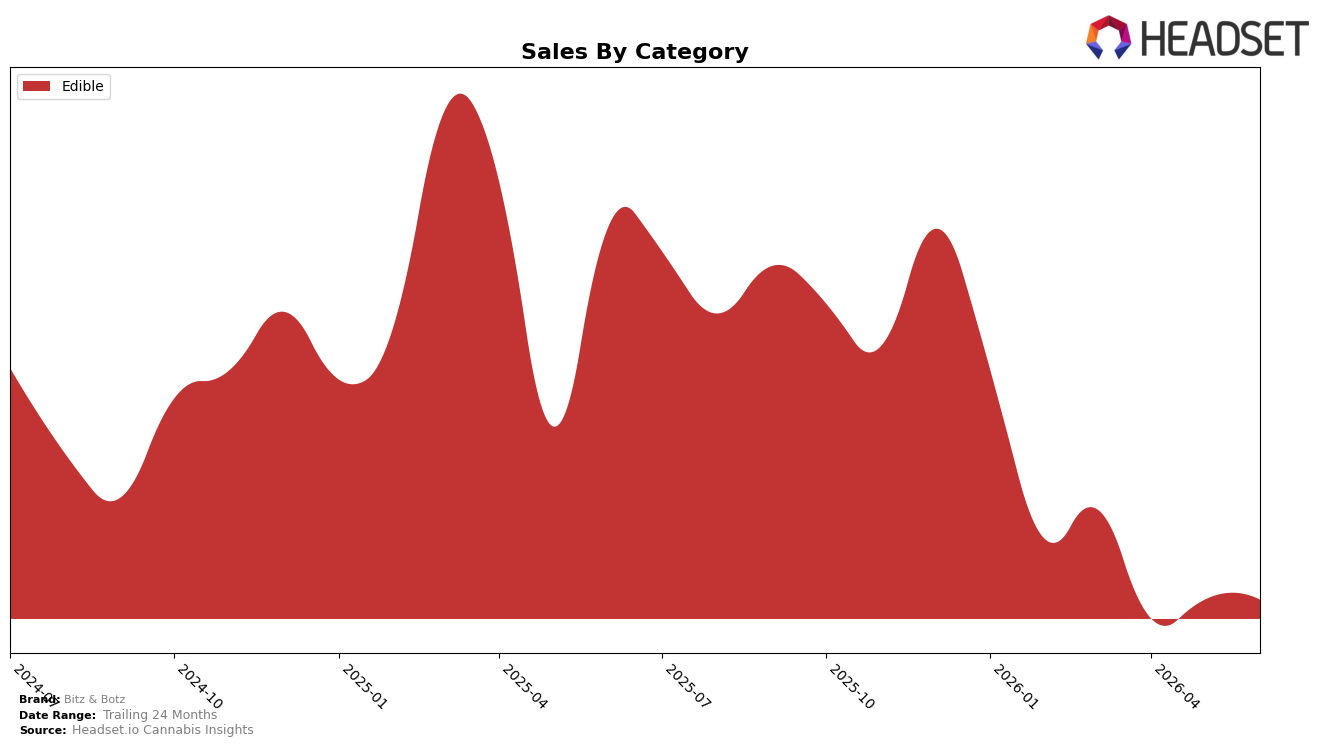
In June 2026, Bitz & Botz operated as a single-category brand with Edible at 100.0% of mix and a rank of 18 in Oregon Edible, pairing a year-over-year sales decline of 53.6% with a month-over-month uptick of 4.9%. Average price fell 4.6% year over year to $3.75 while sales share held at 100.0%, indicating that mix stability did not offset the YoY contraction; the pattern implies price compression alongside a narrow portfolio is limiting recovery despite a June MoM lift.
The shift toward full concentration in Edible at 100.0% share alongside a rank of 18 suggests Bitz & Botz is positioned as a value-leaning, lower-priced offering within Oregon Edible where a 4.6% YoY price drop outpaced the 4.9% MoM sales rise. This combination implies the brand’s current positioning is anchored in price rather than assortment breadth, and the June momentum is more consistent with tactical pricing benefits than category expansion leverage.
Competitive Landscape
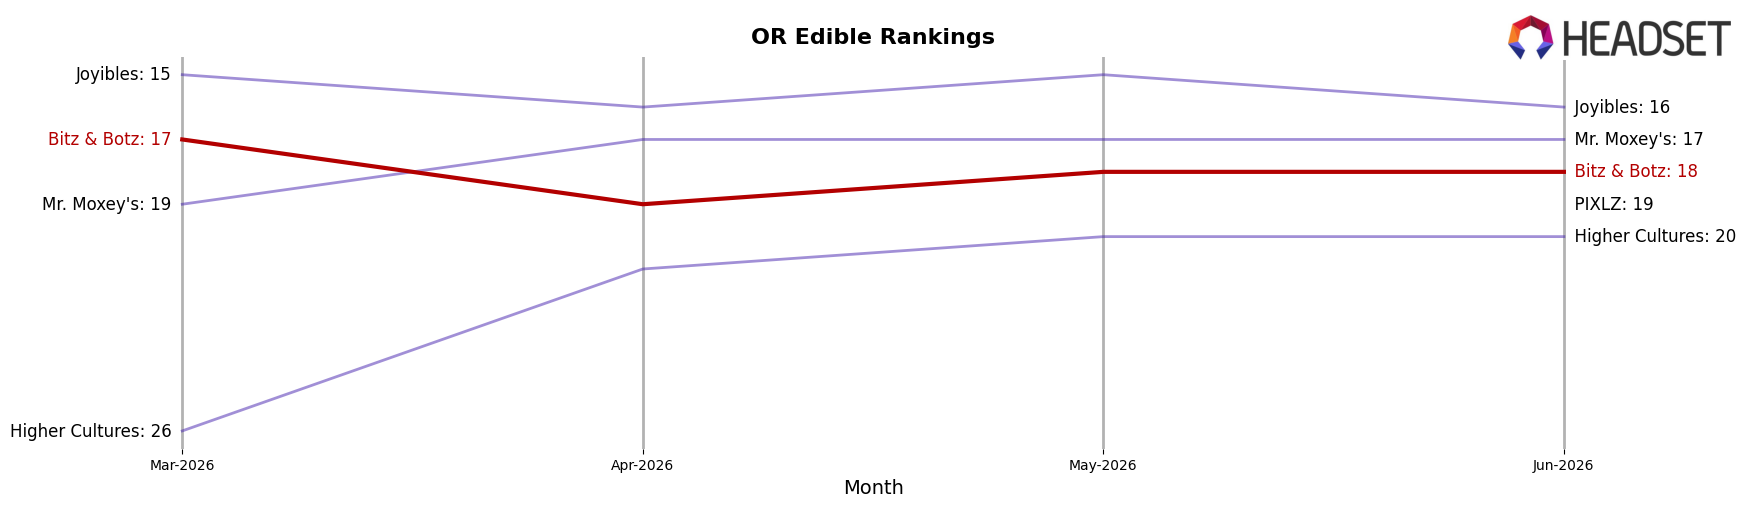
Bitz & Botz sits at rank #18 in OR Edible for June 2026, down 6 positions from #12 year over year, and 1 spot below its March 2026 mark of #17; meanwhile, category leader Wyld held #1 both this year and last as its sales grew 45.3% year over year, while Gron / Grön stayed #2 despite a 104.6% sales decline, indicating Bitz & Botz’s slippage is rank-specific rather than a uniform market collapse. With Bitz & Botz’s peak at #12 in July 2025 and a 6-rank YoY drop to #18 by June 2026, while Good Tide held #4 on 88.9% YoY sales growth and Drops held #3 despite a 4.4% decline, the pattern implies Bitz & Botz is being out-positioned by faster-moving incumbents and needs share-creating moves to avoid further rank erosion.
Notable Products
Sativa Sour Green Apple Gummy (100mg) delivered the headline move in June 2026 with a 1,170.98% month-over-month surge and a jump into rank 3, while Blue Razz Gummy (100mg) fell 63.85% and slid to rank 9. Sour White Cherry Gummy (100mg) also expanded 51.96% to hold rank 1, and Tangerine Gummy (100mg) contracted 21.14% at rank 5, indicating volatility within the same Edible tier. With at least eight of the top ten SKUs in the Edible category and Baja Blasted Gummy (100mg) up 371.59% to rank 8 against Sour Marionberry Gummy (100mg) up 101.16% at rank 7, the mix implies Bitz & Botz is consolidating demand around fast-cycling flavor innovations rather than a broad category spread.
Top Selling Cannabis Brands
Data for this report comes from real-time sales reporting by participating cannabis retailers via their point-of-sale systems, which are linked up with Headset’s business intelligence software. Headset’s data is very reliable, as it comes digitally direct from our partner retailers. However, the potential does exist for misreporting in the instance of duplicates, incorrectly classified products, inaccurate entry of products into point-of-sale systems, or even simple human error at the point of purchase. Thus, there is a slight margin of error to consider. Brands listed on this page are ranked in the top twenty within the market and product category by total retail sales volume.

